🔥 Today Only: Save 30% on Premium — Offer Ends Soon! - Upgrade Now!
Line Graph

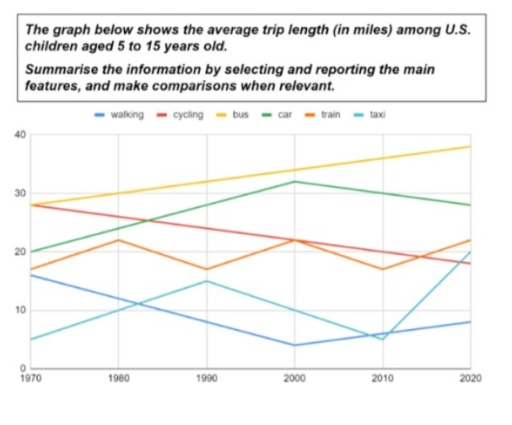
Band 6+: The graph below shows the average trip length in miles among U.S. children aged 5 to 15 years old. Summarise the information by selecting and reporting the main features, and make comparisons where relevant.

Image for topic: The graph below shows the average trip length in miles among U.S. children aged 5 to 15 years old. Summarise the information by selecting and reporting the main features, and make comparisons where relevant.
Our system will evaluate the answer based on this AI-generated description.
The image displays a line graph showing average trip lengths in miles for U.S. children aged 5 to 15 by transportation mode from 1970 to 2020: walking starts at 8 miles in 1970, moderate increase to 10 miles in 1980, peaks at 14 miles in 1990, followed by a decline to 4 miles in 2000, a slight increase to 6 miles in 2010, and stabilizes at 10 miles in 2020; cycling at 26 miles in 1970, decreases steadily to 10 miles by 1990, further declines to 5 miles in 2000, 3 miles in 2010, and remains at 5 miles in 2020; bus, initially 10 miles in 1970, rises to 16 miles in 1980, reaching 22 miles in 1990, remains stable until 2000, then slightly decreases to 18 miles in 2010, consistent at 17 miles in 2020; car, at 25 miles in 1970, gradually rises to 28 miles in 1980, peaked at 32 miles in 2000, slightly drops to 30 miles in 2010, then reaches 36 miles by 2020; train begins at 3 miles in 1970, rising to 6 miles in 1980, oscillates around 4-5 miles through 2000, eventually drops to 2 miles in 2010, stabilizes at 4 miles in 2020; taxi, starting at 5 miles in 1970, increases to 9 miles in 1980, peaking at 12 miles in 2000, a slight decrease to 10 miles in 2010, and remains constant at 12 miles in 2020.
Given the complexity of the image, the above description may not be entirely accurate.
Note: Both the topic and the answer were created by one of our users.

The graph illustrates the length of an average trip for U.S. children aged 5 to 15 years old concerning transportation like walking, cycling, bus, and car among the 50-year period from 1970 to 2020.

Overall, the highest amount of length covered is by bus which has no decline whatsoever and only increases every year, while the trip length by cycling only decreases among the years.

Despite following a downward trend, there is a sharp increase in the miles covered by walking after 2000. This is contrasted by the average length of a trip covered by a car where it began with a gradual increase and reached its highest at 31 miles in 2000, going on to slowly decrease.

Starting from the same point, the mode of cycling has a moderate decrease from 29 miles to 19 miles, whereas the mode of bus rises from 29 miles in 1970 to a total of 38 miles by 2020. holding the most amount of average trip length.

Word Count: 164

Other Topics:

The picture below shows renewable energy use as a proportion of total energy use from 1971 to 2006.

The graph illustrates data about renewable energy use as a proportion of total energy use,over a thirty five-year period between 1971 and 2006. Overall,what stands out of the graph is that there were considerable upward trends in total energy use in United Kingdom,Germany,United States,France and Denmark,while the total energy use in Finland don’t see any […]

The line graph below shows the household recycling rates in three different countries between 2005 and 2015. Summarise the information by selecting and reporting the main features, and make comparisons where relevant.

The line graph illustrates the regional household recycling rates in the UK, France and Germany from 2005 to 2015. Overall, the reusing rates of the UK and Germany showed a gradual yet significant rise over a decade, while the percentage of the recycled rates in France had experience in a downward trend. In 2005, the […]

The line graph below shows the household recycling rates in three different countries between 2005 and 2015. Summarise the information by selecting and reporting the main features, and make comparisons where relevant.

The line graph illustrates the regional household recycling rates in the UK, France and Germany from the year 2005 to 2015. Overall, the reusing rates of the UK and Germany showed a gradual yet significant rise over a decade, while the percentage of the recycled rates in France had experience in a downward trend. In […]

The line graph below details the average monthly social media engagement (in thousands of interactions) per user across four major platforms (platform A, platform B, platform C, and platform D) from 2010 to 2050.

The line graph illustrates data about the average monthly social media engagement per user across four major platforms, platform A, platform B, platform C, platform D, over a 40-year period, starting from 2010 to 2050. Overall, engagement levels across half of platforms increased over the period, with Platform D experiencing the most dramatic growth. In […]

The line graph below shows the percentage of people who used five different communication methods between 1998 and 2008. Summarise the information by selecting and reporting the main features, and make comparisons where relevant. Write at least 150 words.

The line graph illustrates the percentage of individuals who used five different communication ways from 1998 to 2008. Overall, it is readily apparent that the percentage of cellular phone service experienced an upward trend, while the percentage of fixed broadband was considerably the lowest all the time. Additionally, Internet service also rose steadily, while landline […]

See All
We have detected unusual activity on your device.
Please verify your identity to continue.
Note: This verification step won't sign you in. If you have a premium account, please log in to access the service as usual.
Google/Gmail Verification
Or verify using Email/Code
We've sent a verification code to:
youremail@gmail.com (Not your email?)
Enter it below to complete the verification process.
Ensure your email address is correct, your inbox is not full, and you check your spam folder. If no email arrives, consider using an alternative email.
You will need a Premium plan to perform your action!
Note: If you already have a premium account, please log in to access our services as usual.

Plans & Pricing

Our mission is to make quality education accessible for everyone.
However, to keep our hardworking team running and this service alive, we genuinely need your support!
By opting for a premium plan, not only do you sustain us in achieving the mission, but you also unlock advanced features to enrich your learning experience.

Free

For learners who aren't pressed for time

What's included on Free
100+ Cambridge IELTS Tests
Instant IELTS Writing Task 1 & 2 Evaluation (2 times/month)
Instant IELTS Speaking Part 1, 2, & 3 Evaluation (2 times/month)
Instant IELTS Writing Task 1 & 2 Essay Generator (2 times/month)
500+ Dictation & Shadowing Exercises
100+ Pronunciation Exercises
Flashcards
Other Advanced Tools

Premium

For those serious about advancing their English proficiency, and for IELTS candidates aspiring to boost their band score by 1-2 points (especially in writing & speaking) in just 30 days or less

What's included on Premium
Save Your IELTS Test Progress & Analyze Mistakes By Question Type
Save Your Own Flashcard Sets & Use Them On Any Device
Unlock All Courses, IELTS Tests, Section & Part Practice
Unlimited AI Conversations
Unlimited AI Writing Enhancement Exercises
Unlimited IELTS Writing Task 1 & 2 Evaluation
Unlimited IELTS Speaking Part 1, 2, & 3 Evaluation
Checked Answers Will Not Be Published
Unlimited IELTS Writing Task 1 & 2 Essay Generator
Unlimited IELTS Speaking Part 1, 2, & 3 Sample Generator
Unlimited Usage Of Advanced Tools & AI Features
Priority Support within 24h (12-month plan only)

Due to the nature of our service and the provided free trials, payments are non-refundable.