Our system will evaluate the answer based on this AI-generated description.
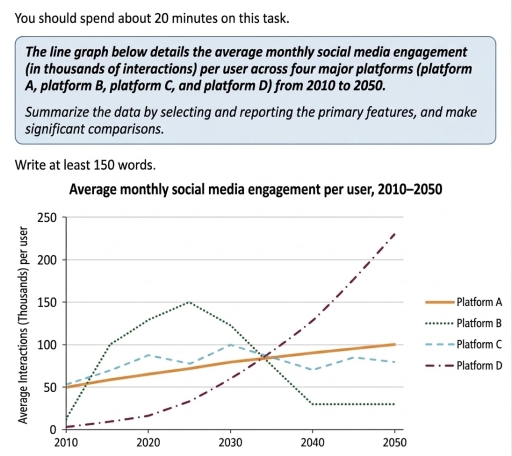
The image displays a line graph titled "Average monthly social media engagement per user, 2010–2050". The vertical axis measures "Average Interactions (Thousands) per user" with values from 0 to 250 in intervals of 50, and the horizontal axis spans the years 2010 to 2050 in 10-year major increments with 5-year data points. The graph tracks four categories: Platform A (solid line), Platform B (dotted line), Platform C (dashed line), and Platform D (dash-dot line). For Platform A, data points are approximately 50 in 2010, 63 in 2020, 75 in 2030, 88 in 2040, and 100 in 2050. For Platform B, values are approximately 15 in 2010, 100 in 2015, 130 in 2020, 150 in 2025, 125 in 2030, 80 in 2035, and 30 across 2040, 2045, and 2050. For Platform C, values stand at approximately 55 in 2010, 70 in 2015, 88 in 2020, 77 in 2025, 100 in 2030, 80 in 2035, 70 in 2040, 85 in 2045, and 80 in 2050. For Platform D, values measure approximately 5 in 2010, 10 in 2015, 17 in 2020, 33 in 2025, 60 in 2030, 90 in 2035, 130 in 2040, 175 in 2045, and 230 in 2050.
Given the complexity of the image, the above description may not be entirely accurate.
Skyrocket your IELTS band score by 1-2 points in under a month with our premium plan!
Note: Both the topic and the answer were created by one of our users.
The line graph illustrates data about the average monthly social media engagement per user across four major platforms, platform A, platform B, platform C, platform D, over a 40-year period, starting from 2010 to 2050.
Overall, engagement levels across half of platforms increased over the period, with Platform D experiencing the most dramatic growth. In contrast, Platform B saw a significant decline after peaking in the middle of the period.
It is clear that, platform C started the period with the highest number of engagement at around 80,000 interactions. This figure stayed almost the same until 2030, after which it fluctuated slightly and reached just under 75,000 by 2050. In comparison, Platform A started at 50,000 in 2010 and grew steadily throughout the 40-year period, reaching roughly 90,000 in 2050.
On the other hand, Platform B and Platform D showed much bigger changes. Platform B increased significantly from 50,000 in 2010 to a peak of nearly 150,000 around 2025. However, it dropped sharply after 2030, reaching a low of nearly 20,000 in 2040 and remaining stable until 2050. In contrast, Platform D started at only 5,000 in 2010. It then rose rapidly from 2020 onwards, finishing at the highest point of over 220,000 interactions by the end of the period.
Word Count: 210
