🔥 Today Only: Save 30% on Premium — Offer Ends Soon! - Upgrade Now!
Line Graph

Band 5+: The graph below shows the percentage of 18-25 year olds in universities in four different countries. Summarize the information by selecting and reporting the main features and make comparisons where relevant.

Image for topic: The graph below shows the percentage of 18-25 year olds in universities in four different countries. Summarize the information by selecting and reporting the main features and make comparisons where relevant.
Our system will evaluate the answer based on this AI-generated description.
The image shows a line graph depicting the percentage of 18-25 year olds in universities across Singapore, Malaysia, Philippines, and Thailand from 1961 to 2011. In 1961, Singapore had roughly 10%, Malaysia approximately 1%, Philippines near 20%, and Thailand close to 0%. By 1971, Singapore reached about 15%, Malaysia rose to 2%, Philippines slightly declined to around 19%, and Thailand remained near 0%. In 1981, Singapore saw an increase to about 25%, Malaysia reached about 5%, Philippines fell back to 10%, and Thailand slightly increased to around 2%. By 1991, Singapore peaked at approximately 40%, Malaysia reached 10%, Philippines stayed around 10%, and Thailand improved to around 5%. By 2001, Singapore hovered at about 42%, Malaysia increased to 15%, Philippines remained steady at 10%, and Thailand approached 10%. Finally, in 2011, Singapore was slightly above 45%, Malaysia was slightly over 30%, Philippines stayed roughly at 10%, and Thailand climbed to around 20%.
Given the complexity of the image, the above description may not be entirely accurate.
Note: Both the topic and the answer were created by one of our users.

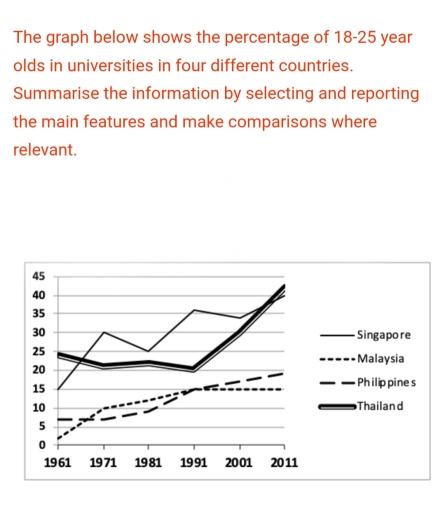
The line graph illustrates the percentage of people aged between 18 and 25 in the universities of four countries: Singapore, Malaysia, Philippines and Thailand, from 1961 to 2011.

Overall, the figures increased in all four countries. Singapore and Thailand had the highest proportions, whereas the Philippines and Malaysia showed the lowest proportions. Although Thailand faced a decline in between, it got a massive increase.

In 1961, Thailand was at the top with a percentage of 25%, meanwhile, in 1991 it got a little decline but it got rapid soared in 2011, accounted for approxmately 42%. Singapore was followed by 15% in 1961 and got a rapid rise of 30% in 1971, but fluctuating steadily and got raised to 40%.

The other two countries, Malaysia and Philippines, were following each other. However, Malaysia had the smallest percentage, accounted for 2% and got a moderate increase of 15% in 1991 and remained constant in 2011. Whereas, Philippines got a significant increase from 5% in 1961 to 20% in 2011.

Word Count: 167

Answers On The Same Topic:

The graph below shows the percentage of 18-25 year olds in universities in four different countries. Summarize the information by selecting and reporting the main features and make comparisons where relevant.

The given chart below exhibits the number of 18-25 year olds in universities in four different countries. Overall,the percentage of Malaysia and Philippines rise gradually without decreasing,while the percentage of Singapore and Thailand a sharp rise without decreasing good numbers changes. Looking at dominant graph,there was an upward trend in four countries.The percentage of Singapore […]

The graph below shows the percentage of 18-25 year olds in universities in four different countries. Summarize the information by selecting and reporting the main features and make comparisons where relevant.

The given graph illustrates the percentage of the 18-25 year-olds enrolled in universities in four Asian countries. Overall, it is evident that Thailand remained the country with the highest university enrollment rate for the majority of the period. All four countries experienced the increase in the percentage of young people attending universities in 1961 to […]

The graph below shows the percentage of 18-25 year olds in universities in four different countries. Summarize the information by selecting and reporting the main features and make comparisons where relevant.

The given graph illustrates the percentage of the 18-25 year olds enrolled in universities in four Asian countries. Overall, it is evident that Thailand remained the country with the highest university enrollment rate for the majority of the period. All four countries experienced the increase in the percentage of young people attending universities in 1961 […]

See All

Other Topics:

The line graph shows the results of a survey giving the reasons why people moved to the capital city of a particular country. Summarize the information by selecting and reporting the main features, and make comparisons where relevant.

The line graph sets out the key motivations for people relocating to the capital of a specific country between 2000 and 2015. Moving for the purpose of study saw the greatest rise overall, with a jump of approximately 62,000. It rose considerably in two periods – from 2000 to 2005 (by 22,000), and then again […]

The graph below shows the changes in production (millions)of three products in agarment factory from 1990 to 2010. Summarize the information by selecting andreporting the main features, and make comparisons where relevant.Write at least 150 words.

The line graph compares cloth production in terms of suit, dress and coat in garment factory between 1990 and 2010. Overall, all categories experienced an upward trend throughout the period, with coat representing the most significant increase. Looking first at suit and dress, the figure for suit stood at 15 million in 1990, then increased […]

Using the visual data, write a Performance Quality Report (PQR) on students' progress after using Perfamica. Write at least 150 words.

The line graph illustrates the percentage of a Performance student’s quality progress after applying Perfamica. Overall, two processes increased over the period. Peer feedback quality had the highest figure in November, also it shows the greatest fluctuation. Average grade and goal achievement demonstrate the similar pattern. Average grade started at 75% in Septenber, subsequently experienced […]

The line graph bellow show the number of international tourists who visited three direerent countries form 2010 to 2030.

The line graph demonstrates the number of overseas visitors’ trips to three different countries over the two decades from 2010 to 2030, categorised into countries A, B, and C. Overall, the number of travellers visiting countries A and B remains in growth throughout the period. Whereas, country C experienced a decline between 2015 and 2020 […]

The line graph bellow show the number of international tourists who visited three direerent countries form 2010 to 2030.

The line graph demonstrates the number of overseas visitors trip to three different countries over the two decades from 2010 to 2030. Categorised into those countries A, B and C. Overall, the number of travellers those visiting country A and B remains its growth thoroughout the period. Whereas, the country C experienced decline between 2015-2020 […]

The graph below gives information about Duabi golsd sales in 2002.

The provided graph illustrates data about Dubai golds transaction in 2002. Overall, gold sales fluctuated over the graph. To have a better and deeper understanding, when looked closely, it could be seen that gold sales increased in March, akin to three months it experienced a decline and then saw an rose again in August. Moreover, […]

See All
We have detected unusual activity on your device.
Please verify your identity to continue.
Note: This verification step won't sign you in. If you have a premium account, please log in to access the service as usual.
Google/Gmail Verification
Or verify using Email/Code
We've sent a verification code to:
youremail@gmail.com (Not your email?)
Enter it below to complete the verification process.
Ensure your email address is correct, your inbox is not full, and you check your spam folder. If no email arrives, consider using an alternative email.
You will need a Premium plan to perform your action!
Note: If you already have a premium account, please log in to access our services as usual.

Plans & Pricing

Our mission is to make quality education accessible for everyone.
However, to keep our hardworking team running and this service alive, we genuinely need your support!
By opting for a premium plan, not only do you sustain us in achieving the mission, but you also unlock advanced features to enrich your learning experience.

Free

For learners who aren't pressed for time

What's included on Free
100+ Cambridge IELTS Tests
Instant IELTS Writing Task 1 & 2 Evaluation (2 times/month)
Instant IELTS Speaking Part 1, 2, & 3 Evaluation (2 times/month)
Instant IELTS Writing Task 1 & 2 Essay Generator (2 times/month)
500+ Dictation & Shadowing Exercises
100+ Pronunciation Exercises
Flashcards
Other Advanced Tools

Premium

For those serious about advancing their English proficiency, and for IELTS candidates aspiring to boost their band score by 1-2 points (especially in writing & speaking) in just 30 days or less

What's included on Premium
Save Your IELTS Test Progress & Analyze Mistakes By Question Type
Save Your Own Flashcard Sets & Use Them On Any Device
Unlock All Courses, IELTS Tests, Section & Part Practice
Unlimited AI Conversations
Unlimited AI Writing Enhancement Exercises
Unlimited IELTS Writing Task 1 & 2 Evaluation
Unlimited IELTS Speaking Part 1, 2, & 3 Evaluation
Checked Answers Will Not Be Published
Unlimited IELTS Writing Task 1 & 2 Essay Generator
Unlimited IELTS Speaking Part 1, 2, & 3 Sample Generator
Unlimited Usage Of Advanced Tools & AI Features
Priority Support within 24h (12-month plan only)

Due to the nature of our service and the provided free trials, payments are non-refundable.