Our system will evaluate the answer based on this AI-generated description.
The image displays a line graph depicting the 2017 monthly revenue data in $US millions for three pizza places in Vietnam. In January: Pizza Hut at 30, Domino Pizza at 10, The Pizza Company at 5. February: Pizza Hut at 25, Domino Pizza at 5, The Pizza Company at 7. March: Pizza Hut at 15, Domino Pizza at 12, The Pizza Company at 12. April: Pizza Hut at 20, Domino Pizza at 15, The Pizza Company at 14. May: Pizza Hut at 10, Domino Pizza at 20, The Pizza Company at 18. June: Pizza Hut at 15, Domino Pizza at 23, The Pizza Company at 20. July: Pizza Hut at 20, Domino Pizza at 30, The Pizza Company at 23. August: Pizza Hut at 25, Domino Pizza at 30, The Pizza Company at 30. September: Pizza Hut at 30, Domino Pizza at 15, The Pizza Company at 20. October: Pizza Hut at 35, Domino Pizza at 20, The Pizza Company at 25. November: Pizza Hut at 40, Domino Pizza at 25, The Pizza Company at 28. December: Pizza Hut at 42, Domino Pizza at 30, The Pizza Company at 30.
Given the complexity of the image, the above description may not be entirely accurate.
Skyrocket your IELTS band score by 1-2 points in under a month with our premium plan!
Note: Both the topic and the answer were created by one of our users.
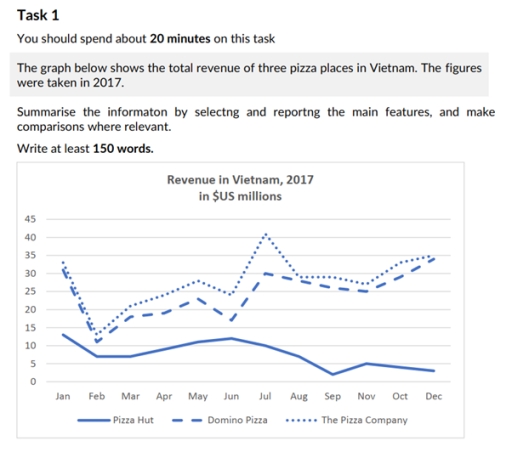
The given line graph illustrates the total expenditure of three pizza areas (Pizza Hut, Domino Pizza, The Pizza Company) in Vietnam in the year 2017. Units are measured in $US millions.
Overall, The Pizza Company was the most popular area over the period, despite significant decline in the beginning. Domino Pizza followed right after The Pizza Company, representing almost same figurea at the start and at the end, whereas Pizza Hut made the least revenue experiencing downward trend.
In early January The Pizza Company was the most widely visited pizza place, which peaked at 35 millions, before falling significantly to just below 15 million in February, however the total expenditure of this company came back to its rate in January (35 millions) by the end. Likewise, Domino Pizza accounted for approximately 30 millions in the beginning of the time scale, after which rates of this place fluctuated widely until reaching the peak of 35 millions, same as The Pizza Company.
Pizza Hut, on the other hand, made up nearly 15 millions in January and remained almost unaltered until September ( 3 millions). Finally, Pizza Hut represented the least total revenue at nearly 5 millions by December.
Word Count: 196
