🔥 Today Only: Save 30% on Premium — Offer Ends Soon! - Upgrade Now!
Multiple Graphs

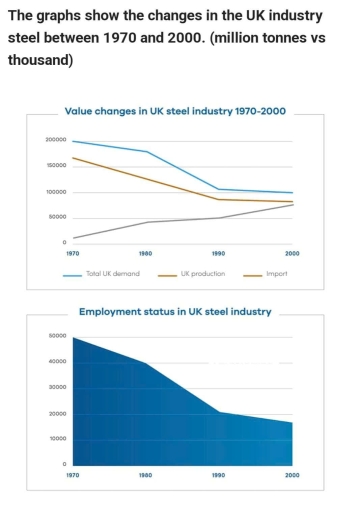
Band 5+: The graph show the changes in the UK industry steel between 1970 and 2000. (million tonnes and thousan)

Image for topic: The graph show the changes in the UK industry steel between 1970 and 2000. (million tonnes and thousan)
Our system will evaluate the answer based on this AI-generated description.
The image contains two graphs. The first graph shows value changes in the UK steel industry from 1970 to 2000 with three lines: Total UK demand, UK production, and Import. In 1970, Total UK demand is approximately 300,000 million tonnes, UK production is shown at around 250,000 million tonnes, and Import is at about 50,000 million tonnes. By 1980, Total UK demand decreases slightly to 275,000 million tonnes, UK production drops to 200,000 million tonnes, and Import remains nearly 50,000 million tonnes. In 1990, Total UK demand further reduces to nearly 220,000 million tonnes, UK production declines to 170,000 million tonnes, while Import slightly rises to 70,000 million tonnes. In 2000, Total UK demand sits near 200,000 million tonnes, UK production drops to 130,000 million tonnes, and Import increases to approximately 100,000 million tonnes. The second graph illustrates employment status in the UK steel industry over the same period. Employment is roughly 200,000 in 1970, reducing to about 125,000 by 1980, then further declining to near 75,000 by 1990, and dropping to approximately 50,000 by 2000.
Given the complexity of the image, the above description may not be entirely accurate.
Note: Both the topic and the answer were created by one of our users.

The given diagrams demonstrate data about value changes and employment status in United Kingdom steel industry between 1970 and 2000.

Overall, the number of total UK demand, production, and emloyees in steel sector declined over the 30-year period, whereas the number of import incresed.

In 1970, the number of total demand, production, and import accounted for 200,000, approximately 170,000 and 10,000 respectively. During the next 20 years, the first two indicators fell to almost 110,000 and 90,000 respectively, while the number of import rised to 50,000. In the next decade, the indicators of total demand and production steadily dipped by 10,000 both. The figure of import inclined to almost 80,000.

In terms of employment in UK steel industry, in 1970, the quantity of employees showed 50,000, the highest number of entire period, and decreased by 10,000 people in 1980. Then, in 1990, this number depriciated to 20,000 employees, and slightly decreased to almost 18,000 in the next century.

Word Count: 158

Answers On The Same Topic:

The graph show the changes in the UK industry steel between 1970 and 2000. (million tonnes and thousan)

The line graph illustrate value changes, while the other graph shows the employment status in the UK industry steel from 1970 to 2000. Overall, import of steel in the UK increased, in contrast total steel demand of UK, and UK production decreased during the period. However, employment status in the UK steel industry went down […]

See All

Other Topics:

The bar chart shows the distribution of employment among agriculture, services, and industries in three countries in 1990 and projected distribution in 2030. Summarize by selecting and reporting the main features, and make comparisons where relevant.

The given bar chart illustrates the distribution of employment among three economic sectors, namely agriculture, industry, and services in three countries from 1990 to 2030. Overall, it can be clearly seen that services were the most highly demanded sector in both Countries A and C in 1990, and this trend was expected to continue in […]

The chart below give information about public library in a town called Little Chalfont

The pie chart and table gives information regarding the library visitor ages in 2018 and writes down the percentage of total loans in 2018 in different kinds of category, meanwhile the bar chart compare the total loans in 2007 untill 2016. Overall the three of these charts provide information about a public library located in […]

The graph and chart below provide information about migration to the UK. The graph shows how long immigrants who arrived between 2000 and 2008 intended to stay in the UK, while the pie chart shows the reasons for migration in 2008. Summarise the information by selecting and reporting the main features, and make comparisons where relevant.

While the line graph depicts intended length of stay of immigrants to the UK from 2000 to 2008, the pie chart shows the proportion of reasons for immigration in 2008. Overall, the number of immigrants intending to stay 4 years and more remained unchanged throughout, whereas both levels of those who planned to live in […]

The charts below show the performance of a bus company in terms of punctuality, both actual and target (what actually happened compared to what the company was trying to achieve), and the number of complaints from passengers. Summarise the information by selecting and reporting the main features, and make comparisons where relevant.

This chart shows the performance of the service arriving on time and the number of complaints, with the report showing data from 1999 to 2003. Overall, the actual service performance fluctuated throughout the period, initially falling below the target before eventually exceeding it in 2003. Meanwhile, the number of complaints generally increased, reaching its highest […]

the graphs below show the total percentage of film released and the total percentages of tickets sales in 1996 and 2006 in a country. Summerize the information by selecting and reporting the main features and make comparisons where relevant.

The graph illustrates the percentage of the total number of film released and the total of tickets sales in 1996 and 2006. Overall, the number of films debuted was higher in 2006 than in 1996 throughout the period in all genres. Regarding ticket sales, drama, comedy, and fantasy increased their popularity in 2006, however romance […]

the charts give information about world forests in five different regions. Summarise the information by selecting and reporting the main features, and make comparisions where relevant.

The first pie chart compares the percentage of world forest of five distinct regions while the second chart illustrates the proportion of timber in the same regions. Overall, Africa has the largest proportion of the world forest; however it shows the least percentage of timber. Noticeably, North America takes up a relatively large rate in […]

See All
We have detected unusual activity on your device.
Please verify your identity to continue.
Note: This verification step won't sign you in. If you have a premium account, please log in to access the service as usual.
Google/Gmail Verification
Or verify using Email/Code
We've sent a verification code to:
youremail@gmail.com (Not your email?)
Enter it below to complete the verification process.
Ensure your email address is correct, your inbox is not full, and you check your spam folder. If no email arrives, consider using an alternative email.
You will need a Premium plan to perform your action!
Note: If you already have a premium account, please log in to access our services as usual.

Plans & Pricing

Our mission is to make quality education accessible for everyone.
However, to keep our hardworking team running and this service alive, we genuinely need your support!
By opting for a premium plan, not only do you sustain us in achieving the mission, but you also unlock advanced features to enrich your learning experience.

Free

For learners who aren't pressed for time

What's included on Free
100+ Cambridge IELTS Tests
Instant IELTS Writing Task 1 & 2 Evaluation (2 times/month)
Instant IELTS Speaking Part 1, 2, & 3 Evaluation (2 times/month)
Instant IELTS Writing Task 1 & 2 Essay Generator (2 times/month)
500+ Dictation & Shadowing Exercises
100+ Pronunciation Exercises
Flashcards
Other Advanced Tools

Premium

For those serious about advancing their English proficiency, and for IELTS candidates aspiring to boost their band score by 1-2 points (especially in writing & speaking) in just 30 days or less

What's included on Premium
Save Your IELTS Test Progress & Analyze Mistakes By Question Type
Save Your Own Flashcard Sets & Use Them On Any Device
Unlock All Courses, IELTS Tests, Section & Part Practice
Unlimited AI Conversations
Unlimited AI Writing Enhancement Exercises
Unlimited IELTS Writing Task 1 & 2 Evaluation
Unlimited IELTS Speaking Part 1, 2, & 3 Evaluation
Checked Answers Will Not Be Published
Unlimited IELTS Writing Task 1 & 2 Essay Generator
Unlimited IELTS Speaking Part 1, 2, & 3 Sample Generator
Unlimited Usage Of Advanced Tools & AI Features
Priority Support within 24h (12-month plan only)

Due to the nature of our service and the provided free trials, payments are non-refundable.