Our system will evaluate the answer based on this AI-generated description.
The image contains two graphs. The first graph shows value changes in the UK steel industry from 1970 to 2000 with three lines: Total UK demand, UK production, and Import. In 1970, Total UK demand is approximately 300,000 million tonnes, UK production is shown at around 250,000 million tonnes, and Import is at about 50,000 million tonnes. By 1980, Total UK demand decreases slightly to 275,000 million tonnes, UK production drops to 200,000 million tonnes, and Import remains nearly 50,000 million tonnes. In 1990, Total UK demand further reduces to nearly 220,000 million tonnes, UK production declines to 170,000 million tonnes, while Import slightly rises to 70,000 million tonnes. In 2000, Total UK demand sits near 200,000 million tonnes, UK production drops to 130,000 million tonnes, and Import increases to approximately 100,000 million tonnes. The second graph illustrates employment status in the UK steel industry over the same period. Employment is roughly 200,000 in 1970, reducing to about 125,000 by 1980, then further declining to near 75,000 by 1990, and dropping to approximately 50,000 by 2000.
Given the complexity of the image, the above description may not be entirely accurate.
Skyrocket your IELTS band score by 1-2 points in under a month with our premium plan!
Note: Both the topic and the answer were created by one of our users.
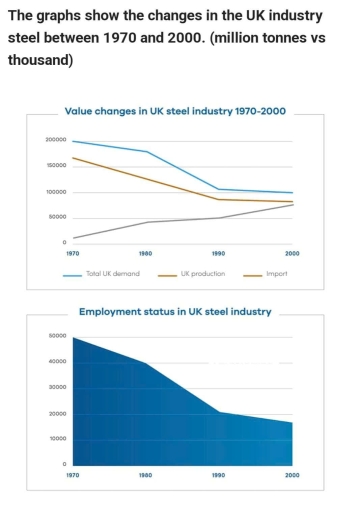
The line graph illustrate value changes, while the other graph shows the employment status in the UK industry steel from 1970 to 2000.
Overall, import of steel in the UK increased, in contrast total steel demand of UK, and UK production decreased during the period. However, employment status in the UK steel industry went down considerably over the years.
In 1970, import of steel was nearly 1000 million tonnes. Between 1980, and 1990 it rose moderately, and ended the period more than 50000 million tonnes. In tems for UK total steel demand, and UK production decreased slightly until 1980. UK total steel demand and UK production were just above and just below 100000 million tonnes respectively in 1990. However, while UK total steel demand stood at 100000, production was less than this figure.
Employment status was the highest in the begining of the period with 50000, it went down moderately for next three decades and it stood at 20000 in 1990. In 2000 saw slightly decrease and the figure for emloyment status was less than 20000.
Word Count: 176
