Our system will evaluate the answer based on this AI-generated description.
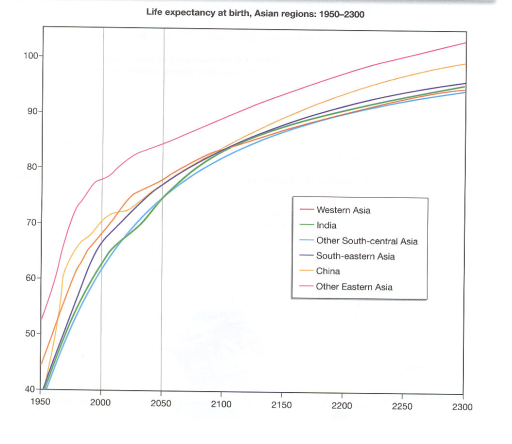
The image shows a line graph displaying the life expectancy at birth for various Asian regions from 1950 to 2300. The y-axis represents life expectancy in years, ranging from 40 to 100, and the x-axis represents the years from 1950 to 2300 in increments of 50 years. There are six colored lines representing Western Asia (blue), India (red), Other South-central Asia (orange), China (green), South-eastern Asia (purple), and Other Eastern Asia (yellow). Each line starts at different points in 1950, with Western Asia having the highest life expectancy around 67 years, and Other South-central Asia having the lowest at approximately 41 years. All lines show an upward trend, with Western Asia maintaining the highest life expectancy throughout the years, reaching close to 100 years by 2300. The other regions show varying degrees of increase, with India and Other Eastern Asia reaching around 95 years, Other South-central Asia and South-eastern Asia reaching around 90 years, and China having a slightly lower life expectancy around 87 years by 2300.
Given the complexity of the image, the above description may not be entirely accurate.
Skyrocket your IELTS band score by 1-2 points in under a month with our premium plan!
Note: Both the topic and the answer were created by one of our users.
The line chart provides information about the life expectancy trends in the Asia region from 1950 and forecasts until 2300.
Overall, there was a rose in life expectancy across six regions in Asia such as Western Asia, India, Other south-central Asia, South-eastern Asia, China and other Eastern Asia. Additionally, other Eastern Asia shows the most significant anticipation.
By 2000, people in other Eastern Asia and China experienced the highest rose in age expectancy. It increased from approximately 53 to 78 age expectancy in the other Eastern Asia and from about 40 to 70 years in China. Othe regions experienced an increase also, however there were all accounted in approximately 60-65 years.
During the nowadays new period of 50 years, life expectancy in all regions experiences a slight increase. other Eastern Asia illustrates a rise to approximately 84 years. Other regions reach about 73 to 76 years in our time.
Consistently, the life expectancy of individuals will be rising, and they are forecast to increase more stably until 2300. The highest number will show the other Eastern Asia and China reaching approximately 105 and 100 years respectively, while other regions will have almost the same results accounted for around 90 years
Word Count: 200
