🔥 Today Only: Save 30% on Premium — Offer Ends Soon! - Upgrade Now!
Line Graph

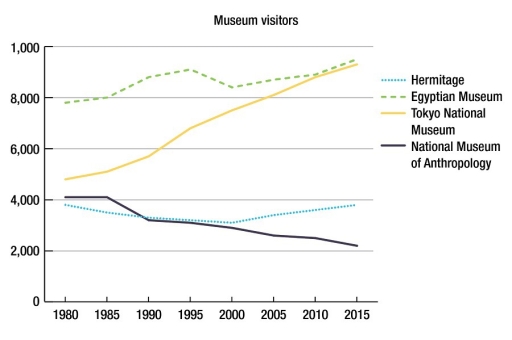
Band 5+: The graph shows the number of visitors to four international museums between 1980 and 2015. Summarise the graph by selecting and reporting the main features and make comparisons where relevant.

Image for topic: The graph shows the number of visitors to four international museums between 1980 and 2015. Summarise the graph by selecting and reporting the main features and make comparisons where relevant.
Our system will evaluate the answer based on this AI-generated description.
The image displays a line graph titled "Museum visitors" with the x-axis showing years from 1980 to 2015 in intervals of 5 and the y-axis showing visitor numbers from 0 to 10,000 in intervals of 2,000. There are four lines representing different museums: the Hermitage with a dotted line, Egyptian Museum with a dashed line, Tokyo National Museum with a solid bold line, and National Museum of Anthropology with a fine solid line. The Hermitage line starts just above 2,000 in 1980 and ends just below 10,000 in 2015, showing a steady increase with slight fluctuations. The Egyptian Museum line starts around 1,500 in 1980 and ends above 8,000 in 2015, showing a steeper increase with some fluctuations. The Tokyo National Museum line starts just below 2,000 in 1980 and ends over 6,000 in 2015, with a gradual increase and some periods of stability. The National Museum of Anthropology line starts just above 6,000 in 1980 and ends just below 4,000 in 2015, showing a decline with minor fluctuations.
Given the complexity of the image, the above description may not be entirely accurate.
Note: Both the topic and the answer were created by one of our users.

The given line graph illustrates the amount of tourists visited global exhibitions during the period from 1980 to 2015.

Overall, the four museums experienced different trends with some fluctuations. While at the beginning of the period, Egyptian Museum and Hermitage respectively had the highest and lowest figures of visitors among four groups examined, but Tokyo National Museum rocketed to reach the same highest level with Egyptian Museum and National Museum of Anthropology decreased to the lowest at the end of the period.

There was a significant growth in the number of sightseers of Tokyo National Museum between 1980 and 2015, which increased from over 4,000 to under 10,000 people and reached the highest figure at the end. The amount of visitors of National Museum of Anthropology stabilized before it had a small drop and steadily declined from 1985 onwards, reduced by a half compared to the beginning of the period.

Although having a fall in 2000, Egyptian Museum’s quantity of tourists rose gradually from a little under 8,000 to around 9,500 people during the period. The number of sightseers visited Hermitage decreased from approximately 4,000 to around 3,000 in 2000, then it moderately grew till the end and had the similar level with its figure at the beginning of this thirty-five-year period.

Word Count: 212

Answers On The Same Topic:

The graph shows the number of visitors to four international museums between 1980 and 2015. Summarise the graph by selecting and reporting the main features and make comparisons where relevant.

The line graph illustrates the number of visitors to four international museums over a period of 35 years, including the Hermitage, the Egyptian Museum, the Tokyo National Museum, and the National Museum of Anthropology. Overall, the figures for visitors to the Hermitage and the Egyptian Museum remained steady, with the Egyptian Museum recording the highest […]

The graph shows the number of visitors to four international museums between 1980 and 2015. Summarise the graph by selecting and reporting the main features and make comparisons where relevant.

The line graph illustrates the number of visitors to four international museums over a period of 35 years, including the Hermitage, the Egyptian Museum, the Tokyo National Museum, and the National Museum of Anthropology. Overall, the figures for visitors to the Hermitage and the Egyptian Museum remained steady, with the Egyptian Museum recording the highest […]

The graph shows the number of visitors to four international museums between 1980 and 2015. Summarise the graph by selecting and reporting the main features and make comparisons where relevant.

The given chart illustrates the number of visitors to four different international museums from 1980 to 2015. Overall, while the number of visitors to the Tokyo National Museum and the Egyptian Museum witnessed considerable upward trends, the National Museum of Anthropology fell remarkably during the same period. The number of visitors to the Hermitage remained […]

The graph shows the number of visitors to four international museums between 1980 and 2015. Summarise the graph by selecting and reporting the main features and make comparisons where relevant.

The given chart illustrates how many visitors went to 4 different international museums from 1980 to 2015. Overall, while the visitors of Tokyo National Museum and Egyptian Museum witnessed considerable upward trends, that figure of National Museum of Anthropology fell remarkably at the same time. The visitors of Hermitage remained unchanged over the period. Notably, […]

The graph shows the number of visitors to four international museums between 1980 and 2015. Summarise the graph by selecting and reporting the main features and make comparisons where relevant.

The line graph demonstrates how many people who visited four different international museums over a period of 35 years from 1980. Overall, travelers to Egyptian and Tokyo National Museums saw an upward trend, the reverse patterns could be seen in the figures for Hermitage and National Museum of Anthropology. Additionally, the number of visitors to […]

See All

Other Topics:

The line graph shows the amount of income from cinema ticket and DVD sales in the USA and internationally from 2001 to 2010.

The graph shows how much money the film industry made by selling cinema tickets and DVDs in the USA and abroad between 2001 and 2010. The chart gives an overview of the changes in cinema and DVD sales in the United States and the rest of the world over a ten-year period. From the chart, […]

The line graph shows the amount of income from cinema ticket and DVD sales in the USA and internationally from 2001 to 2010.

*The graph shows how much money the film industry made by selling cinema tickets and DVDs in the USA and abroad between 2001 and 2010. The graph shows that although the US market for DVD and cinema ticket sales was as big in 2001 as all the other countries, by the end of the study, […]

The line graph shows the percentages of Australian exports with four countries. The graph below shows the percentage of Australian exports to 4 countries from 1990 to 2012.

The line graph provides information about sugar production and consumption in India between 2001 and 2011. Overall, the amount of sugar production and consumption showed an upward trend throughout the period. Additionally, the figure for consumption experienced a consistent rise, whereas the figure for production fluctuated considerably. Focusing on sugar production first, despite a noticeable […]

Writing Task 1: Number of Jobs The line chart shows trends in terms of employment in the USA in millions and predictions for the future.

The graph below illustrates four sectors of job in which economy of united state was involved during the period 1960-2020. Overall, there are four sectors in which manufacturing had the highest involvement followed by retail and agriculture where as healthcare was listed in lowest number of participant. In the beginning year, Manufacturing recorded the largest […]

The line graph shows the percentages of Australian exports with four countries. The graph below shows the percentage of Australian exports to 4 countries from 1990 to 2012.

The graph provides information about the sugar production and consumption in india between 2001 and 2011. Overall, while the production of sugar was unstable all the time, the reverse was true for consumption of sugar in india. Focusing on the production of sugar at first, in 2001 the first productions started with about 18 million […]

The line graph shows the percentages of Australian exports with four countries. The graph below shows the percentage of Australian exports to 4 countries from 1990 to 2012.

The graph below gives information of sugar production and consumption from 2001 to 2011 in india. Overall, both production and consumption saw a rise, the biggest change happened production which rose from 14 to 30, and the smallest change was in consumption which rose from 20 to 21. Looking into 2001, consumption started at 15 […]

See All
We have detected unusual activity on your device.
Please verify your identity to continue.
Note: This verification step won't sign you in. If you have a premium account, please log in to access the service as usual.
Google/Gmail Verification
Or verify using Email/Code
We've sent a verification code to:
youremail@gmail.com (Not your email?)
Enter it below to complete the verification process.
Ensure your email address is correct, your inbox is not full, and you check your spam folder. If no email arrives, consider using an alternative email.
You will need a Premium plan to perform your action!
Note: If you already have a premium account, please log in to access our services as usual.

Plans & Pricing

Our mission is to make quality education accessible for everyone.
However, to keep our hardworking team running and this service alive, we genuinely need your support!
By opting for a premium plan, not only do you sustain us in achieving the mission, but you also unlock advanced features to enrich your learning experience.

Free

For learners who aren't pressed for time

What's included on Free
100+ Cambridge IELTS Tests
Instant IELTS Writing Task 1 & 2 Evaluation (2 times/month)
Instant IELTS Speaking Part 1, 2, & 3 Evaluation (2 times/month)
Instant IELTS Writing Task 1 & 2 Essay Generator (2 times/month)
500+ Dictation & Shadowing Exercises
100+ Pronunciation Exercises
Flashcards
Other Advanced Tools

Premium

For those serious about advancing their English proficiency, and for IELTS candidates aspiring to boost their band score by 1-2 points (especially in writing & speaking) in just 30 days or less

What's included on Premium
Save Your IELTS Test Progress & Analyze Mistakes By Question Type
Save Your Own Flashcard Sets & Use Them On Any Device
Unlock All Courses, IELTS Tests, Section & Part Practice
Unlimited AI Conversations
Unlimited AI Writing Enhancement Exercises
Unlimited IELTS Writing Task 1 & 2 Evaluation
Unlimited IELTS Speaking Part 1, 2, & 3 Evaluation
Checked Answers Will Not Be Published
Unlimited IELTS Writing Task 1 & 2 Essay Generator
Unlimited IELTS Speaking Part 1, 2, & 3 Sample Generator
Unlimited Usage Of Advanced Tools & AI Features
Priority Support within 24h (12-month plan only)

Due to the nature of our service and the provided free trials, payments are non-refundable.