🔥 Today Only: Save 30% on Premium — Offer Ends Soon! - Upgrade Now!
Multiple Graphs

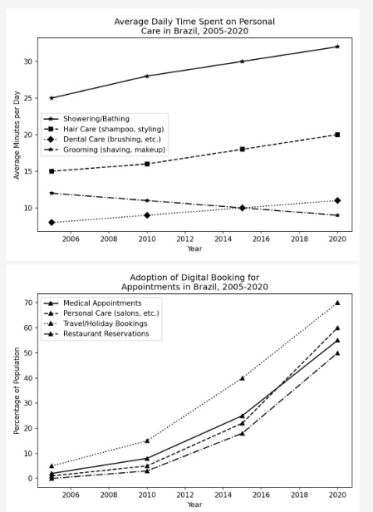
Band 7+: The graphs below show average daily time spent on personal care and the percentage of digital booking for appointment in Brazil between 2006 and 2020.

Image for topic: The graphs below show average daily time spent on personal care and the percentage of digital booking for appointment in Brazil between 2006 and 2020.
Our system will evaluate the answer based on this AI-generated description.
The image displays two line graphs. The top graph, titled "Average Daily Time Spent on Personal Care in Brazil, 2005-2020", has an x-axis labeled "Year" and a y-axis labeled "Average Minutes per Day" (range 10 to 30), reporting data for four categories in 2005, 2010, 2015, and 2020: Showering/Bathing (2005: 25, 2010: 28, 2015: 30, 2020: 32), Hair Care (shampoo, styling) (2005: 15, 2010: 16, 2015: 18, 2020: 20), Grooming (shaving, makeup) (2005: 12, 2010: 11, 2015: 10, 2020: 9), and Dental Care (brushing, etc.) (2005: 8, 2010: 9, 2015: 10, 2020: 11). The bottom graph, titled "Adoption of Digital Booking for Appointments in Brazil, 2005-2020", has an x-axis labeled "Year" and a y-axis labeled "Percentage of Population" (range 0 to 70), tracking four categories across the same years: Travel/Holiday Bookings (2005: 5%, 2010: 15%, 2015: 40%, 2020: 70%), Personal Care (salons, etc.) (2005: 1%, 2010: 5%, 2015: 22%, 2020: 60%), Medical Appointments (2005: 2%, 2010: 8%, 2015: 25%, 2020: 55%), and Restaurant Reservations (2005: 0%, 2010: 3%, 2015: 18%, 2020: 50%).
Given the complexity of the image, the above description may not be entirely accurate.
Note: Both the topic and the answer were created by one of our users.

The presented line graphs illustrate the average time which was spent on personal care activities and the proportion of people who used a digital booking system for appointment in Brazil over a span of 14 years from 2006 to 2020.

Generally, all average daily time which was spent on personal care and adoption on digital booking for appointments experienced an upward trend, while grooming (exception) showed a downward trend.

At the beginning of the period, medical appointments were recorded at around 1%, followed by restaurant reservation and personal care, at 0%. These figures rose significantly to a range between 45% and 50% in 2020. However, travel/holiday bookings, which initially stood at around 5%, surged to almost 70% by the end of the period.

By comparison, showering and bathing accounted for 25%. This was then followed by a slight increase to almost 40% in 2020. Hair care and dental care began the period at 15% and 5% before rising to 18% and 10%, respectively. In contrast, grooming declined from around 12% to 7% in 2020.

Word Count: 174

Other Topics:

The pie charts below show tourist visit to four different types of attraction in the UK in two years.

The pie charts compare the percentage of tourists who visited different attractions in the UK in 1981 and 1999. Overall, it is clear that the highest proportion of tourists visited in museums and galleries, while the rate of tourists who visited in wildlife parks and zoos was the lowest throughout the period. In 1981, the […]

The pie chart below shows the average household expenditures in a country in 1950 and 2010. Write a report for a university lecturer describing the information below.

The two pie charts compare the changes in how much money was spent on different household categories in a specific country between 1950 and 2010. Overall, domestic expenses experienced a significant change throughout the period. While the majority of categories grew considerably, housing lost its dominance and witnessed a very dramatic drop. Meanwhile, the food […]

The chart shows the jobs of men and women in 2005 and 2015.

The bar charts compared the percentage of men and women employees across five different job domains in the year 2005 and 2015. Overall, it is evident from the given graphs that in both given years female employees were more in administrator job while male employees joined job as vice president and analysts in higher proportion […]

The pie chart shows the main reason why agricultural land becomes less productive

The pie chart shows four main reasons why land is degrading worldwide, while the table shows the causes of land degradation across three regions: North America, Europe and Oceania, measured in percentages. Overall, it’s evident that overgrazing caused by far the largest percentage of global land degradation in the world. Additionally, Europe experienced the highest […]

The charts below show the percentage of working time in office spending on different tasks in the US in 1980 and 2006.

The provided pie charts delineate the proportional distribution of time allocated to diverse office activities in the United States, comparing the years 1980 and 2006. A salient trend is the ascendance of computer usage, which maintained a dominant share, whereas reliance on paper documents and interpersonal interactions diminished considerably over the 26-year period. in 1980, […]

See All
We have detected unusual activity on your device.
Please verify your identity to continue.
Note: This verification step won't sign you in. If you have a premium account, please log in to access the service as usual.
Google/Gmail Verification
Or verify using Email/Code
We've sent a verification code to:
youremail@gmail.com (Not your email?)
Enter it below to complete the verification process.
Ensure your email address is correct, your inbox is not full, and you check your spam folder. If no email arrives, consider using an alternative email.
You will need a Premium plan to perform your action!
Note: If you already have a premium account, please log in to access our services as usual.

Plans & Pricing

Our mission is to make quality education accessible for everyone.
However, to keep our hardworking team running and this service alive, we genuinely need your support!
By opting for a premium plan, not only do you sustain us in achieving the mission, but you also unlock advanced features to enrich your learning experience.

Free

For learners who aren't pressed for time

What's included on Free
100+ Cambridge IELTS Tests
Instant IELTS Writing Task 1 & 2 Evaluation (2 times/month)
Instant IELTS Speaking Part 1, 2, & 3 Evaluation (2 times/month)
Instant IELTS Writing Task 1 & 2 Essay Generator (2 times/month)
500+ Dictation & Shadowing Exercises
100+ Pronunciation Exercises
Flashcards
Other Advanced Tools

Premium

For those serious about advancing their English proficiency, and for IELTS candidates aspiring to boost their band score by 1-2 points (especially in writing & speaking) in just 30 days or less

What's included on Premium
Save Your IELTS Test Progress & Analyze Mistakes By Question Type
Save Your Own Flashcard Sets & Use Them On Any Device
Unlock All Courses, IELTS Tests, Section & Part Practice
Unlimited AI Conversations
Unlimited AI Writing Enhancement Exercises
Unlimited IELTS Writing Task 1 & 2 Evaluation
Unlimited IELTS Speaking Part 1, 2, & 3 Evaluation
Checked Answers Will Not Be Published
Unlimited IELTS Writing Task 1 & 2 Essay Generator
Unlimited IELTS Speaking Part 1, 2, & 3 Sample Generator
Unlimited Usage Of Advanced Tools & AI Features
Priority Support within 24h (12-month plan only)

Due to the nature of our service and the provided free trials, payments are non-refundable.