Our system will evaluate the answer based on this AI-generated description.
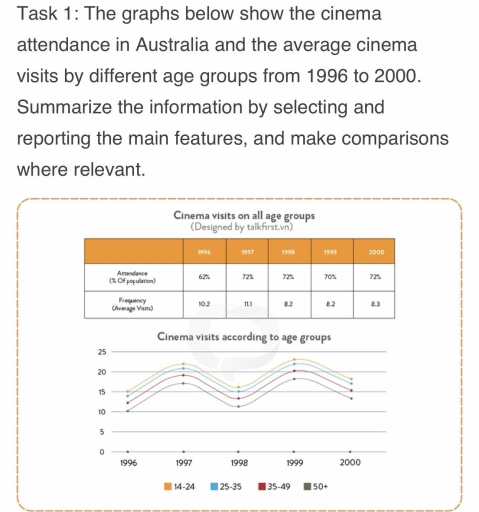
The image displays data on cinema attendance in Australia from 1996 to 2000: Attendance averaged as percentages of the population are 62% in 1996, 72% in 1997, 72% in 1998, 70% in 1999, and 72% in 2000; Frequency averaged as visits are 10.3 in 1996, 11.1 in 1997, 8.2 in 1998, 8.2 in 1999, and 8.3 in 2000; Cinema visits segmented by age groups from 1996-2000 where age 14-24 recorded approximately 19 visits in 1996, 23 visits in 1997, 15 visits in 1998, 18 visits in 1999, 13 visits in 2000; age 25-34 logged about 14 visits in 1996, 15 visits in 1997, 10 visits in 1998, 13 visits in 1999, 11 visits in 2000; age 35-49 noted close to 11 visits in 1996, 16 visits in 1997, 9 visits in 1998, 12 visits in 1999, 13 visits in 2000; age 50+ reported roughly 13 visits in 1996, 12 visits in 1997, 5 visits in 1998, 11 visits in 1999, 12 visits in 2000.
Given the complexity of the image, the above description may not be entirely accurate.
Skyrocket your IELTS band score by 1-2 points in under a month with our premium plan!
Note: Both the topic and the answer were created by one of our users.
The line graph illustrates data about film attendance per year in Australia from the year 1990 to 2010. By looking at the overall trend of the chart, people aged 14-24 went to the cinema the most every year, starting from 1990 to 2010. However, individuals who are 50 years old and above are the least likely to visit the theatre to watch movies.
Elaborating on the paragraph above, the highest percentage of teenagers and young adults visiting the auditorium is on average above 90% throughout the eleven years; in 2010, it almost reached the 100% mark. On the other hand, people over the age of fifty have the lowest percentage of cinema attendance; in 1990, it hit the lowest point at 40%, while the highest rate for this group was 60%.
The rest of the two age ranges over the years are surprisingly more or less hitting similar percentages each year. For instance, during 2006, people aged 35-49 and those aged 25 up to 34 had the same ratios, both hitting 80%. Similarly, at the start, in 1990, both groups of adults had nearly the same percentage, which was 60%.
Word Count: 190
