Our system will evaluate the answer based on this AI-generated description.
The image displays a line chart with average monthly rainfall (in inches) for three towns, unnamed, spanning January to December. In January, rainfall figures are approximately Town1: 6, Town2: 5, Town3: 9. February figures show Town1: 5, Town2: 5, Town3: 8. March shows Town1 rising to around 6, Town2: 6, Town3 stabilizing at 8. April figures are Town1: 6.5, Town2: 6.5, Town3: 10. May sees Town1: 6.5, Town2 reaching 8.5, Town3 peaking at 11. June shows a rise to Town1: 8.5, Town2: 9.5, Town3 hits peak at approximately 13.5. July sees a slight dip across Town1: 8, Town2: 9, Town3: 13. August remains largely stable with Town1: 8, Town2: 8.5, Town3 dropping slightly to 12. September figures decline further to Town1: 7, Town2: 7.5, Town3: 11. October shows Town1: 6, Town2: 6.5, Town3: 9.5. November sees Town1: 5.5, Town2: 6, Town3 further reducing to 8.5. December culminates in Town1 stabilizing at 5, Town2 at 7, and Town3 dropping to 7.
Given the complexity of the image, the above description may not be entirely accurate.
Skyrocket your IELTS band score by 1-2 points in under a month with our premium plan!
Note: Both the topic and the answer were created by one of our users.
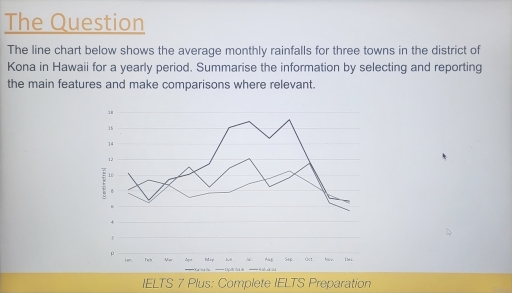
The line graph gives information about three cities monthly average rainfall, which is located in Kona district of Hawaii.
Overall, Kainaliu city has the highest average rainfall throughout year, although the lowest was recorded for Opihihale town.
Notably, Kainaliu town had just over 10 centimeter of rain in january, and the second highest was at 8 centimeters for Holualoa, and they both follow the similar pattern and shows fluctuations throughout the year. Kainaliu experienced steep increase in numbers after feb to reach the heaviest rainfall of 17 centimeter by september. Similarly, Holualoa saw larger fluctuation in rainfall than kainaliu, and reached the highest mark of just over 12 centimeters in july. The rainfall sharply decline for both Kainaliu and Holualoa, and hit the lowest figure by december; 7 & 5.75 centimeter respectively.
On the other hand, the rainfall recorded in january for Opihihale was 7.8 centimetres, which gradually increased to 9.6 in feb, and slowly decline to 7 centimetres by april. Just like Kainaliu, the figure rose and reached its heaviest rainfall in september (10.3), and plunged to its lowest 6.2 centimetres in december (higher than Holualoa).
Word Count: 187
