🔥 Today Only: Save 30% on Premium — Offer Ends Soon! - Upgrade Now!
Line Graph

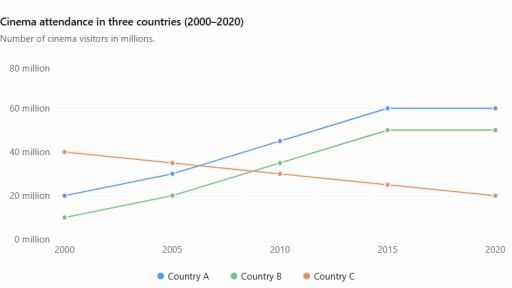
Band 5+: The line graph below illustrates the number of people (in millions) who visited cinemas in three different countries between 2000 and 2020.

Image for topic: The line graph below illustrates the number of people (in millions) who visited cinemas in three different countries between 2000 and 2020.
Our system will evaluate the answer based on this AI-generated description.
The image features a line graph titled "Cinema attendance in three countries (2000–2020)" with the subtitle "Number of cinema visitors in millions." The vertical axis measures visitors from 0 million to 80 million in 20 million increments (0 million, 20 million, 40 million, 60 million, 80 million), while the horizontal axis displays five-year intervals from 2000 to 2020 (2000, 2005, 2010, 2015, 2020). The legend identifies three entities: Country A, Country B, and Country C. For Country A, data values are 20 million in 2000, 30 million in 2005, 45 million in 2010, 60 million in 2015, and 60 million in 2020. For Country B, attendance values are 10 million in 2000, 20 million in 2005, 35 million in 2010, 50 million in 2015, and 50 million in 2020. For Country C, attendance values are 40 million in 2000, 35 million in 2005, 30 million in 2010, 25 million in 2015, and 20 million in 2020.
Given the complexity of the image, the above description may not be entirely accurate.
Note: Both the topic and the answer were created by one of our users.

The provided line graph shows the number of individuals (in millions) who attended cinemas in three different countries between 2000 and 2020, over 20 years period,

All in all, cinema attendance considerably increased in countries A and B, whereas country C experienced dramaticly decline throughout the period. Furthermore, initially country C had the highest figure of visitors; however, it was overtakeny by other two countries. By the end of period, Country A had the highest figure.

In 2000, country C had the largest numbers of visitors, at 40 million, compared with country A of 20 million and country B 10 million. Furthermore, country C experienced steadly declline over the following years, falling to 35 million in 2005 and just 30 million in 2010, the downward trend continued, with dropping figure to 25 million before reaching to it’s lowest point of 20 million in 2020.

In sharp contrast, the other two countries followed an upward trend. Country A had the 20 million figure in 2000, whereas country B has the lowest number of cinema visitors of 10 million in the same year. Moreover countries A and B figures increased to 40 millions in 2010, before reaching their highest point of 55 millions in 2020.

Word Count: 203

Answers On The Same Topic:

The line graph below illustrates the number of people (in millions) who visited cinemas in three different countries between 2000 and 2020.

The provided line graph compares the number of individuals ( in millions) who visited cinemas in three different countries between 2000 and 2020, a period of 20 years. All in all, cinema attendance increased considerably in countries A and B, whereas there was a significant decline in country C throughout the period. Furthermore, country C […]

See All

Other Topics:

The chart shows the number of shops that closed and the number of new shops opening in a country from 2011 to 2018.

The line graph tracks the number of shops that closed and the number that opened in one country over the eight years from 2011 to 2018. Overall, closures outstripped openings in all but two years, 2011 and 2015. Openings declined markedly over the period as a whole, whereas closures, despite an extraordinary but brief collapse […]

The graph below shows the production levels of the main kinds of fuel in the UK between 1981 and 2000. Summarise the information by selecting and reporting the main features, and make comparisons where relevant.

The line graph below illustrates the level of production of UK main types of fuel from 1981 to 2000. Overall,it is clear that petroleum fluctuated but was the leader of energy units through the years. Additionally, coal fluctuated sharply in the beginning and both coal and natural gas production experienced a opposite trend by 2000 […]

The graph below shows the number of international students enrolled in universities in Australia, Canada, and the UK between 2000 and 2020. Summarize the information by selecting and reporting the main features, and make comparisons where relevant.

The line graph illustartes international student numbers with studying in three different countries over a 10-years period starting from 2010 to 2020. Overall, it is clear that the number of foreigners in Country A fell steadily, whereas there found the international students in Country B increased gradually. In the part of Country C started with […]

The chart below gives information about car ownership in the UK from 1975 to 2005. Summarize the information by selecting and reporting the main features and make comparisons where relevant.

The chart illustrates the trend in car ownership in the UK between 1975 and 2005 across various categories. Overall, the proportion of individuals owning one car remained the highest throughout the 30-year-period. Simultaneously, two and three cars ownership experienced an upward trend, whereas non-car ownership declined sharply. In 1975, the volume of households owning no […]

Number of books borrowed from four villages from four village libraries

The provided line graph illustrates the quantity of borrowed books from 4 different villages with 4 various libraries over a 4 month from June to September. Overall, it is clear that in Ryeslip books were more in demand among others, however throughout the period it started to lose its audience gradually. While Sutton Wood was […]

See All
We have detected unusual activity on your device.
Please verify your identity to continue.
Note: This verification step won't sign you in. If you have a premium account, please log in to access the service as usual.
Google/Gmail Verification
Or verify using Email/Code
We've sent a verification code to:
youremail@gmail.com (Not your email?)
Enter it below to complete the verification process.
Ensure your email address is correct, your inbox is not full, and you check your spam folder. If no email arrives, consider using an alternative email.
You will need a Premium plan to perform your action!
Note: If you already have a premium account, please log in to access our services as usual.

Plans & Pricing

Our mission is to make quality education accessible for everyone.
However, to keep our hardworking team running and this service alive, we genuinely need your support!
By opting for a premium plan, not only do you sustain us in achieving the mission, but you also unlock advanced features to enrich your learning experience.

Free

For learners who aren't pressed for time

What's included on Free
100+ Cambridge IELTS Tests
Instant IELTS Writing Task 1 & 2 Evaluation (2 times/month)
Instant IELTS Speaking Part 1, 2, & 3 Evaluation (2 times/month)
Instant IELTS Writing Task 1 & 2 Essay Generator (2 times/month)
500+ Dictation & Shadowing Exercises
100+ Pronunciation Exercises
Flashcards
Other Advanced Tools

Premium

For those serious about advancing their English proficiency, and for IELTS candidates aspiring to boost their band score by 1-2 points (especially in writing & speaking) in just 30 days or less

What's included on Premium
Save Your IELTS Test Progress & Analyze Mistakes By Question Type
Save Your Own Flashcard Sets & Use Them On Any Device
Unlock All Courses, IELTS Tests, Section & Part Practice
Unlimited AI Conversations
Unlimited AI Writing Enhancement Exercises
Unlimited IELTS Writing Task 1 & 2 Evaluation
Unlimited IELTS Speaking Part 1, 2, & 3 Evaluation
Checked Answers Will Not Be Published
Unlimited IELTS Writing Task 1 & 2 Essay Generator
Unlimited IELTS Speaking Part 1, 2, & 3 Sample Generator
Unlimited Usage Of Advanced Tools & AI Features
Priority Support within 24h (12-month plan only)

Due to the nature of our service and the provided free trials, payments are non-refundable.