Our system will evaluate the answer based on this AI-generated description.
The image displays "Monthly Revenue of Jewelry & Co." with the y-axis showing "thousands of euros" from 0 to 90 in increments of 10, and the x-axis depicting months from January to December. Four shops are represented: Shop 1 (triangle symbol), Shop 2 (circle symbol), Shop 3 (square symbol), and Shop 4 (diamond symbol). Shop 1 starts at 40, steadily increases, dips below 60 in April, peaks at 80 in May, decreases to below 60 in July, exceeds 70 in August, drops to 60 in September, and surpasses 80 in December. Shop 2 commences at 20, experiences a slight drop in February, rises to over 60 in June, reduces to 50 in August, climbs to 75 in November, and marginally declines in December. Shop 3 starts at 15, steadily ascends to over 70 in October, slightly diminishes in November, and reaches approximately 80 in December. Shop 4 begins at over 10, gradually increases to above 70 in May, drops to around 70 in June, July, and August, ascends to peak at 90 in October and November, and drops to 85 in December.
Given the complexity of the image, the above description may not be entirely accurate.
Skyrocket your IELTS band score by 1-2 points in under a month with our premium plan!
Note: Both the topic and the answer were created by one of our users.
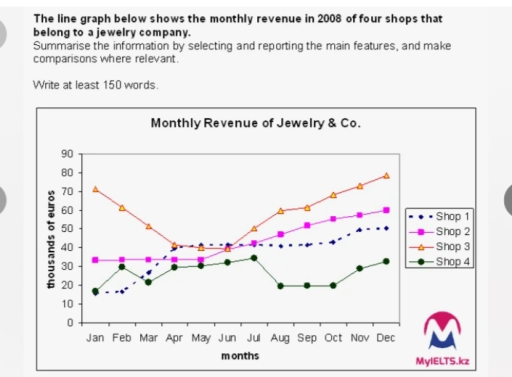
The given line graph illustrates the monthly sales revenue in thousands of euros of four shops belonging to Jewelry & Co, a jewelry company.
Overall, the third shop remained dominant by a large margin bringing the most finance to the company, while revenue from the fourth shop was negligible compared to the other three entities. From January to June, the third shop showed a downward pattern hitting a plateau of 40,000 euros; meanwhile, after June onwards, the third shop showed a significant increase in revenue, thereby reaching a peak of almost 80,000 euros from sales.
The revenue from the second shop, shown as a purple line, remained flat for five months (from January to May) and amounted to 35,000 euros; however, after May and onwards, it began rising slightly reaching its highest sales volume of 60,000 euros. The fourth shop, however, was chaining its pattern every season.
From February until May, the first and third shops showed an inverse correlation: the revenue from the first shop was increasing slightly, while the sales volume from the third shop demonstrated a negative pattern. From April to October, the third shop’s sales rate stayed the same equaling 40,000 euros.
Word Count: 196
