🔥 Today Only: Save 30% on Premium — Offer Ends Soon! - Upgrade Now!
Line Graph

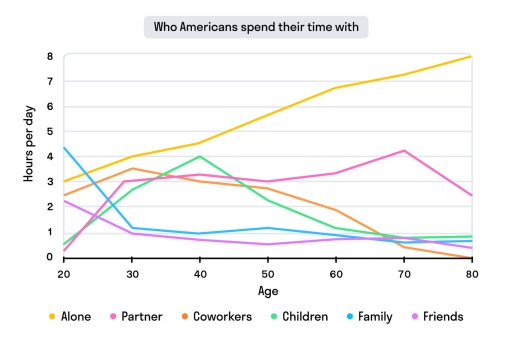
Band 5+: The line graph below shows who Americans spend their time with, by age. Summarise the information by selecting and reporting the main features, and make comparisons where relevant.

Image for topic: The line graph below shows who Americans spend their time with, by age. Summarise the information by selecting and reporting the main features, and make comparisons where relevant.
Our system will evaluate the answer based on this AI-generated description.
The image depicts a line graph detailing hours per day Americans of various ages spend with different groups: at age 20, "Alone" is 3 hours, "Partner" 2 hours, "Coworkers" 1.5 hours, "Children" 0 hours, "Family" 2.5 hours, "Friends" 2 hours; at age 30, "Alone" is 2 hours, "Partner" 3 hours, "Coworkers" 2 hours, "Children" 1 hour, "Family" 1.5 hours, "Friends" 1 hour; at age 40, "Alone" decreases to 1.5 hours, "Partner" remains 3 hours, "Coworkers" 2 hours, "Children" 2 hours, "Family" remains 1.5 hours, "Friends" 1 hour; at age 50, "Alone" increases to 3 hours, "Partner" remains steady, "Coworkers" decreases to 1.5 hours, "Children" remains 1.5 hours, "Family" 1 hour, "Friends" 0.5 hours; at age 60, "Alone" is at 4 hours, "Partner" 3 hours, with joint decreases for "Coworkers", "Children", "Family", and "Friends" to relatively low levels; "Alone" further climbs to 5 hours by age 70, and peaks at 7.5 hours by age 80, while all other categories diminish to near zero by age 80.
Given the complexity of the image, the above description may not be entirely accurate.
Note: Both the topic and the answer were created by one of our users.

The line graph illustrates the changes in who Americans spend their time with across 6 different preferences over the ages from 20 to 80.

From an overall perspective, it is clear that partner, children, family coworker and friend groups experienced downward trend by the time, while Americans spend significantly more time alone as they getting older. Despite being the highest category at the start, time spent with family ended almost the lowest figure.

At the age of 20, Americans spent 3 hours alone, then its time rose gradually during the whole life enging up in 8 hours at eighties. In the beginning, spending life with a partner stood at just above 0 hours per day. However, its time experienced dramatic rise until it climbed to just over 4 hours in seventies. Having increased, time spending with a partner dropped to approximately 2.5 hours per day by the end.

In contrast, friends and coworkers started at nearly 2.5 hours, then friends saw a slight decrease, whereas spent time with coworkers grew steadily. Friends and coworkers time reached their end at fust below 1 hour per day. A sharp increase can be seen in children time starting from about 30 minutes per day and reached its peak at 4 hours per day. Having increased, then its time fell steeply to just under 1 hour per day.

Word Count: 224

Answers On The Same Topic:

The line graph below shows who Americans spend their time with, by age. Summarise the information by selecting and reporting the main features, and make comparisons where relevant.

The chart illustrates the changes in Americans’ choice of who to spend their time with during their life from 20 to 80 years. Overall, the time spent alone increases significantly corresponding to the age. Meanwhile, all the other connections, such as family, friends, coworkers and children are on their peak of the number of hours […]

See All

Other Topics:

The chart below shows the total volume of telephone calls (in million minutes) in Denmark, divided into three categories, from 1995-2004.

The line graph illustrates the total volume of phone callls divided into three categories, namely national landline, international landline, and mobile, in Denmark from 1995 to 2004. Overall, it is clear that three categories showed three different angels. National landline fluctuated througouht the period whereas mobile increased significantly. Meanwile, international landline almost remained stable. Regarding […]

The line graph compares the percentage of people in three countries who used internet between 1999 and 2009.

The diagram illustrates the comparison of percentage of internet users in three nations throughout a decade from 1999. Overall, all three countries registered a constant rise throughout the period. At the beginning, USA saw the most internet users, next came Canada. Last came Mexico only having half of Canada’s proportion. First looking at USA, the […]

The line chart below shows leisure time activities of older Americans between 1990 and 2020. Summarise the information by selecting and reporting the main features, and make comparisons where relevant.

The line graph illustrates the percentages of older Americans who engaged in four different leisure activities between 1990 and 2020. Overall, it is evident that watching television remained by far the most popular activity throughout the period. In addition, although gardening was initially more popular activity than internet use, the proportion of people using the […]

The graph below shows the average monthly change in the prices of three meals during 2014. Summerize the information by selecting and reporting main features and make comparisions where relevant.

This line graph depicts the average fluctuation in prices of three kinds of meal each month over the year of 2014. To a large extent, the proportions of copper and zinc stay constant, while nickel decreased massively to the lowest. Nickel held the highest level of all three meals at the start , then decreased […]

The line chart below shows the number of cars produced in three countries from 2003 to 2009. Summarise the information by selecting and reporting the main features, and make comparisons where relevant.

The given line chart illustrates the quantity of automobiles manufactured in three nations consisting Argentina, Australia and Thailand between 2003 and 2009. From an overall perspective, it is evident that the number of automobiles produced in Australia and Thailand showed an upward trend, whereas a reverse pattern could be seen in the figure for Argentina […]

See All
We have detected unusual activity on your device.
Please verify your identity to continue.
Note: This verification step won't sign you in. If you have a premium account, please log in to access the service as usual.
Google/Gmail Verification
Or verify using Email/Code
We've sent a verification code to:
youremail@gmail.com (Not your email?)
Enter it below to complete the verification process.
Ensure your email address is correct, your inbox is not full, and you check your spam folder. If no email arrives, consider using an alternative email.
You will need a Premium plan to perform your action!
Note: If you already have a premium account, please log in to access our services as usual.

Plans & Pricing

Our mission is to make quality education accessible for everyone.
However, to keep our hardworking team running and this service alive, we genuinely need your support!
By opting for a premium plan, not only do you sustain us in achieving the mission, but you also unlock advanced features to enrich your learning experience.

Free

For learners who aren't pressed for time

What's included on Free
100+ Cambridge IELTS Tests
Instant IELTS Writing Task 1 & 2 Evaluation (2 times/month)
Instant IELTS Speaking Part 1, 2, & 3 Evaluation (2 times/month)
Instant IELTS Writing Task 1 & 2 Essay Generator (2 times/month)
500+ Dictation & Shadowing Exercises
100+ Pronunciation Exercises
Flashcards
Other Advanced Tools

Premium

For those serious about advancing their English proficiency, and for IELTS candidates aspiring to boost their band score by 1-2 points (especially in writing & speaking) in just 30 days or less

What's included on Premium
Save Your IELTS Test Progress & Analyze Mistakes By Question Type
Save Your Own Flashcard Sets & Use Them On Any Device
Unlock All Courses, IELTS Tests, Section & Part Practice
Unlimited AI Conversations
Unlimited AI Writing Enhancement Exercises
Unlimited IELTS Writing Task 1 & 2 Evaluation
Unlimited IELTS Speaking Part 1, 2, & 3 Evaluation
Checked Answers Will Not Be Published
Unlimited IELTS Writing Task 1 & 2 Essay Generator
Unlimited IELTS Speaking Part 1, 2, & 3 Sample Generator
Unlimited Usage Of Advanced Tools & AI Features
Priority Support within 24h (12-month plan only)

Due to the nature of our service and the provided free trials, payments are non-refundable.