🔥 Today Only: Save 30% on Premium — Offer Ends Soon! - Upgrade Now!
Line Graph

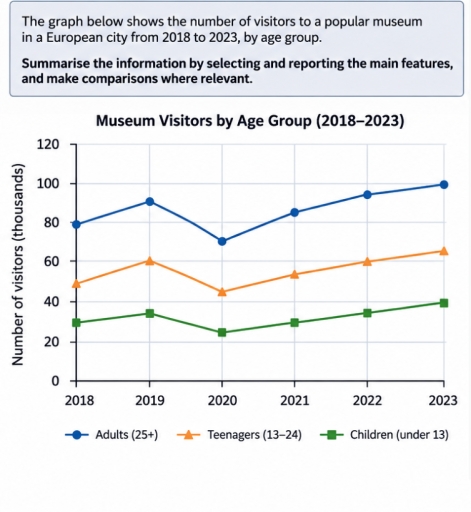
Band 7+: The line graph shows the number of people who visited a popular museum in a European city from 2018 to 2023, by age group.

Image for topic: The line graph shows the number of people who visited a popular museum in a European city from 2018 to 2023, by age group.
Our system will evaluate the answer based on this AI-generated description.
The image features a line graph titled "Museum Visitors by Age Group (2018–2023)", with the vertical axis labeled "Number of visitors (thousands)" spanning from 0 to 120 in increments of 20, and the horizontal axis showing the years 2018, 2019, 2020, 2021, 2022, and 2023. Three categories are displayed: Adults (25+), Teenagers (13–24), and Children (under 13). For Adults (25+), visitor numbers are approximately 79 thousand in 2018, 91 thousand in 2019, 70 thousand in 2020, 85 thousand in 2021, 94 thousand in 2022, and 100 thousand in 2023. For Teenagers (13–24), figures are approximately 49 thousand in 2018, 60 thousand in 2019, 45 thousand in 2020, 53 thousand in 2021, 60 thousand in 2022, and 65 thousand in 2023. For Children (under 13), values are approximately 29 thousand in 2018, 34 thousand in 2019, 24 thousand in 2020, 30 thousand in 2021, 34 thousand in 2022, and 39 thousand in 2023.
Given the complexity of the image, the above description may not be entirely accurate.
Note: Both the topic and the answer were created by one of our users.

The line graph provided showcases the amount of people who have visited a popular museum in a European city starting 2018 and up until 2023, counting by an age group.

Overall, all 3 of the age groups experienced a similar trend with only some insignificant alterations. The count began seeing an insignificant increase in numbers, followed by a decline in similar value and a gradual rise right after.

When observing the most popular category of visitors, being adults aged over 25+, it becomes evident that there was a small rise in 2019, going from 79,000 up to 91,000, which was followed by a sharp decrease in numbers right after, reaching the lowest amount recorded. Starting 2020 and until 2023 there has been a gradual rise of visitors peaking at 100,000.

Observing the other 2 groups, 12-24 year old teenagers and children under 13, both exhibit a near identical statistical pattern. In 2019 they have experienced a steady increase, however reaching slightly lower numbers of 45,000 for teenagers and 25,000 for children with a 20,000 difference in 2020. Right after there can be seen another steady climb going into 2023, although less steep compared to adults aged 25+ in the same timeframe.

Word Count: 201

Other Topics:

The graphs below show the production of renewable energy by source and the carbon dioxide (CO2) emissions from different sectors in Brazil between 2000 and 2020. Summarise the information by selecting and reporting the main features, and make comparisons where relevant.

The given line graphs provide information about the primary sources of renewable energy, as well as the CO2 emission categorized by sector in Brazil in the years between 2000 and 2020. Overall, it is apparent that the main producer of clean energy in Brazil is hydropower while the primary contributor of CO2 emission is the […]

The graph below shows the consumption of fish in different kinds of meat in a European country between 1979 and 2004

The line graph illustrates weekly per capita consumption of fish and three types of meat in a European country from 1979 to 2004. Overall, chicken consumption experienced a dramatic surge, overtaking beef to become the most popular item by the end of the period. Conversely, consumption of beef and lamb declined substantially, while fish remained […]

the line graph shows clothing exports in 1990 to 2013

The line graph illustrates clothing exports in Columbia, Japan and Myanmar from 1990 to 2013. Overall, Myanmar experienced considerable fluctuation throughout the period, especially the most dramatic change was seen in the first decade. While Columbia and Japan remained relatively stable. Myanmar’s clothing exports skyrocketed from almost zero in 1990 to around 800 million in […]

The graph below shows the number of people employed in sport in thousands in selected EU countries between 2011 and 2014. Summarise the information by selecting and reporting the main features, and make comparisons where relevant.

The chart illustrates the amount of thousands of employment in sport in EU countries from 2011 to 2014. Overall, The level of employment in Denmark, Czech Republic, and Belgium was the highest in 2011, while other countries stayed below with the Estonia remains lowest throughout the year. Started off with the emploment amount in 2011, […]

The graph below shows the percentage of workers in 5 different European countries with a day or more absence from 1991 to 2001.

The provided line chart compares the proportion of employees absenting from illness in five different European countries, between 1991 to 2001 Overall, the Netherlands recorded the highest percentage of worker with illness absence throughout the period. France’s figure experienced a dramatic decline towards the end, whereas Sweden figure rose steadily and recorded the greatest increase. […]

See All
We have detected unusual activity on your device.
Please verify your identity to continue.
Note: This verification step won't sign you in. If you have a premium account, please log in to access the service as usual.
Google/Gmail Verification
Or verify using Email/Code
We've sent a verification code to:
youremail@gmail.com (Not your email?)
Enter it below to complete the verification process.
Ensure your email address is correct, your inbox is not full, and you check your spam folder. If no email arrives, consider using an alternative email.
You will need a Premium plan to perform your action!
Note: If you already have a premium account, please log in to access our services as usual.

Plans & Pricing

Our mission is to make quality education accessible for everyone.
However, to keep our hardworking team running and this service alive, we genuinely need your support!
By opting for a premium plan, not only do you sustain us in achieving the mission, but you also unlock advanced features to enrich your learning experience.

Free

For learners who aren't pressed for time

What's included on Free
100+ Cambridge IELTS Tests
Instant IELTS Writing Task 1 & 2 Evaluation (2 times/month)
Instant IELTS Speaking Part 1, 2, & 3 Evaluation (2 times/month)
Instant IELTS Writing Task 1 & 2 Essay Generator (2 times/month)
500+ Dictation & Shadowing Exercises
100+ Pronunciation Exercises
Flashcards
Other Advanced Tools

Premium

For those serious about advancing their English proficiency, and for IELTS candidates aspiring to boost their band score by 1-2 points (especially in writing & speaking) in just 30 days or less

What's included on Premium
Save Your IELTS Test Progress & Analyze Mistakes By Question Type
Save Your Own Flashcard Sets & Use Them On Any Device
Unlock All Courses, IELTS Tests, Section & Part Practice
Unlimited AI Conversations
Unlimited AI Writing Enhancement Exercises
Unlimited IELTS Writing Task 1 & 2 Evaluation
Unlimited IELTS Speaking Part 1, 2, & 3 Evaluation
Checked Answers Will Not Be Published
Unlimited IELTS Writing Task 1 & 2 Essay Generator
Unlimited IELTS Speaking Part 1, 2, & 3 Sample Generator
Unlimited Usage Of Advanced Tools & AI Features
Priority Support within 24h (12-month plan only)

Due to the nature of our service and the provided free trials, payments are non-refundable.