🔥 Today Only: Save 30% on Premium — Offer Ends Soon! - Upgrade Now!
Map

Band 7+: The maps below show changes to the ground floor plan of a university department in 1980 and 2010. Summarize the information by selecting and reporting the main features and make comparisons where relevant.

Image for topic: The maps below show changes to the ground floor plan of a university department in 1980 and 2010. Summarize the information by selecting and reporting the main features and make comparisons where relevant.
Our system will evaluate the answer based on this AI-generated description.
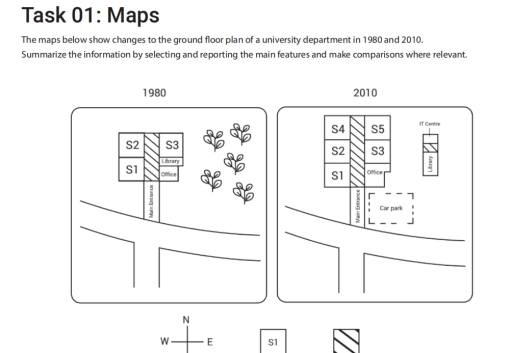
The image is a graphical representation of two floor plans for a university department, one from 1980 and the other from 2010. The 1980 map shows three seminar rooms labeled S1, S2, S3, a library, and an administrative area positioned in a cluster, with a compass indicating north at the bottom left. There is a path leading towards the administrative area, with trees alongside it. The 2010 map also displays three seminar rooms labeled S1, S2, S3, and adds two lecture rooms labeled S4, S5. The library and administrative area have been replaced by an information center, a car park has been added, and the orientation of the rooms and car park have changed. There is a compass indicating north at the bottom left, consistent with the one on the 1980 map. Side paths connect the seminar rooms to a central path. There are no numerical data points or percentages provided on either map.
Given the complexity of the image, the above description may not be entirely accurate.
Note: Both the topic and the answer were created by one of our users.

The maps show how the ground floor of a university department changed between 1980 and 2010.

Overall, the department became much larger with more rooms. The most important changes were the addition of new seminar rooms, the relocation of the library, and the removal of the trees to build a car park.

In 1980, there were only three seminar rooms (S1, S2, and S3). By 2010, the corridor was extended (kéo dài) to the north to add two more rooms, S4 and S5. While S1 and S2 stayed the same, the office was made bigger because the old library was moved to a new place.

On the right side of the map, the trees from 1980 were cut down. In 2010, a new building was built in the northeast corner for a new library and an IT centre. Also, a new car park was built in the southeast area, which did not exist before.

Word Count: 154

Answers On The Same Topic:

The maps below show changes to the ground floor plan of a university department in 1980 and 2010. Summarize the information by selecting and reporting the main features and make comparisons where relevant.

The maps illustrate how 3 decade(1980-2010) of the redevelopment had reshaped the layout of the university department. From the overall perspective , the area of the university block had undergone significant transformation in terms of its accessibility due to of addition new parking facilities, as well as the comprehensive expansion of its academic and administrative […]

The maps below show changes to the ground floor plan of a university department in 1980 and 2010. Summarize the information by selecting and reporting the main features and make comparisons where relevant.

The two plans illustrate the changes made to the ground floor of a university department between 1980 and 2010. Overall, it is clear that the number of rooms increased over the period, while the green area was removed and replaced with new facilities for students. In addition, several new functional spaces, such as an IT […]

The maps below show changes to the ground floor plan of a university department in 1980 and 2010. Summarize the information by selecting and reporting the main features and make comparisons where relevant.

The two given plans describe alters to the ground floor of a university department between 1980 and 2010. Overall, it is clear that number of sectors has increased, while green area was replaced by new designated studiyng places. According to what is shown in maps, ground floor have changed signficantly. The number of sectors inside […]

The maps below show changes to the ground floor plan of a university department in 1980 and 2010. Summarize the information by selecting and reporting the main features and make comparisons where relevant.

The given maps illustrate alterations made to the ground floor of a university department in 1980 and 2010, showcasing a tendency toward enhanced functional utilization of space. Overall, over the 30-year period, the university department underwent significant renovations, with the most notable change being the enlargement of the main building, alongside the construction of new […]

See All

Other Topics:

The maps below show a bookstore in 2000 and now. Summaries the information by selecting and reporting the main features, and make comparisons where relevant. You should write at least 150 words.

The maps illustrate a bookstore in 2000 and now. Overall. this location has already gone through many alternatives including rebuilding the strutures in some specific parts and adding new functions to the place. There is the maintenance in the position of service desk, travel and new books places which are in the bottom of the […]

The maps below show the changes in the town of Dalton between 1815 and 2015.

The maps shows the differences of daltons town between the years 1815 and 2015. Overall, there are significat changes in the map where we can we can assume that the city was transform from old village to new modern city.Many new building are added which is good sing of development. The noticable change in the […]

WRITING TASK 1 You should spend about 20 minutes on this task. The map below is of the town of Garlsdon. A new supermarket is planned for the town. The map shows two possible sites for the supermarket. Summarize the information by selecting and reporting the main features, and make comparisons where relevant. Write at least 150 words.

The map demonstrates the sites S1 and S2 in the town where new super markets will be erected. Overall, S1 will be situated in outskirts of the town , near the urban areas whereas, S2 is located in the heart of the city. Both sites are being well connected with infrastucture of the town. Site […]

The maps illustrate the changes in Frenton between 1990 and 2012.

The map compares the changes in Frenton between 1990 and 2012. Overall, Frenton has become modernized place over the years. In the west side of the High Street, bank has been knocked down to become a restaurant while school and library stayed the same. On the other hand, Hospital expanded throughout the years and filled […]

map shows how the floor plan of a building changed over a large period

This map shows how the floor plan of a building changed over a large period of time from 1958 to present. It started as an office, after 27 years it became an apartment and begining from 2001 it is a flower shop. Overall, the only room that remained consistent in its location throughout the years […]

The two maps demonstrate what happened in Kimsville, from 2002 to the present day

The provided maps illustrate the changes that have taken place in Kimsville between 2002 and the present day. Overall, the town has undergone considerable development over the period shown, with several new residential, commercial and transport facilities added. However, the shopping centre and city centre have remained unchanged. In the northern part of the town, […]

See All
We have detected unusual activity on your device.
Please verify your identity to continue.
Note: This verification step won't sign you in. If you have a premium account, please log in to access the service as usual.
Google/Gmail Verification
Or verify using Email/Code
We've sent a verification code to:
youremail@gmail.com (Not your email?)
Enter it below to complete the verification process.
Ensure your email address is correct, your inbox is not full, and you check your spam folder. If no email arrives, consider using an alternative email.
You will need a Premium plan to perform your action!
Note: If you already have a premium account, please log in to access our services as usual.

Plans & Pricing

Our mission is to make quality education accessible for everyone.
However, to keep our hardworking team running and this service alive, we genuinely need your support!
By opting for a premium plan, not only do you sustain us in achieving the mission, but you also unlock advanced features to enrich your learning experience.

Free

For learners who aren't pressed for time

What's included on Free
100+ Cambridge IELTS Tests
Instant IELTS Writing Task 1 & 2 Evaluation (2 times/month)
Instant IELTS Speaking Part 1, 2, & 3 Evaluation (2 times/month)
Instant IELTS Writing Task 1 & 2 Essay Generator (2 times/month)
500+ Dictation & Shadowing Exercises
100+ Pronunciation Exercises
Flashcards
Other Advanced Tools

Premium

For those serious about advancing their English proficiency, and for IELTS candidates aspiring to boost their band score by 1-2 points (especially in writing & speaking) in just 30 days or less

What's included on Premium
Save Your IELTS Test Progress & Analyze Mistakes By Question Type
Save Your Own Flashcard Sets & Use Them On Any Device
Unlock All Courses, IELTS Tests, Section & Part Practice
Unlimited AI Conversations
Unlimited AI Writing Enhancement Exercises
Unlimited IELTS Writing Task 1 & 2 Evaluation
Unlimited IELTS Speaking Part 1, 2, & 3 Evaluation
Checked Answers Will Not Be Published
Unlimited IELTS Writing Task 1 & 2 Essay Generator
Unlimited IELTS Speaking Part 1, 2, & 3 Sample Generator
Unlimited Usage Of Advanced Tools & AI Features
Priority Support within 24h (12-month plan only)

Due to the nature of our service and the provided free trials, payments are non-refundable.