Our system will evaluate the answer based on this AI-generated description.
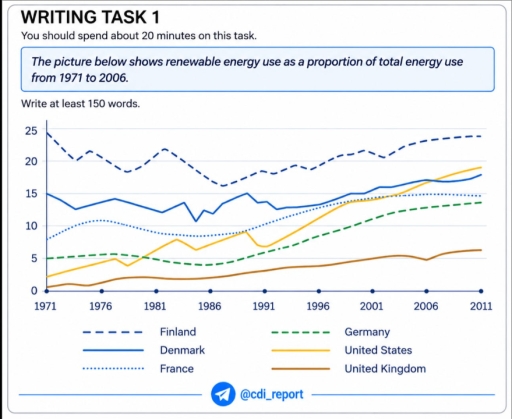
The image presents a line graph with a vertical axis ranging from 0 to 25 with tick marks and horizontal grid lines at increments of 5 (0, 5, 10, 15, 20, 25) and a horizontal axis marked at 5-year intervals with dots: 1971, 1976, 1981, 1986, 1991, 1996, 2001, 2006, and 2011. A legend specifies six series: Finland (dashed line), Denmark (solid line), France (dotted line), Germany (dashed line), United States (solid line), and United Kingdom (solid line). Approximate plotted values across years are: Finland: 1971: 24.5, 1974: 20, 1976: 21.5, 1982: 22, 1987: 16, 1991: 18.5, 1996: 19, 2001: 21.5, 2006: 23, 2011: 24; Denmark: 1971: 15, 1974: 12.5, 1977: 14, 1982: 12, 1985: 10.5, 1989: 15, 1991: 13.5, 1996: 13, 2001: 15, 2006: 17, 2011: 17.5; France: 1971: 8, 1976: 11, 1981: 9, 1986: 8.5, 1991: 10.5, 1996: 13, 2001: 14.5, 2006: 14.8, 2011: 14.8; Germany: 1971: 5, 1976: 5.5, 1981: 5, 1986: 4, 1991: 6, 1996: 8, 2001: 11, 2006: 13, 2011: 13.5; United States: 1971: 2, 1976: 4.5, 1977: 5, 1978: 3.5, 1983: 8, 1985: 6.5, 1989: 9, 1991: 6.5, 1996: 10, 2001: 14, 2006: 16.5, 2011: 19; United Kingdom: 1971: 0.5, 1976: 1, 1981: 2, 1986: 2, 1991: 3, 1996: 4, 2001: 5, 2006: 4.5, 2011: 6.
Given the complexity of the image, the above description may not be entirely accurate.
Skyrocket your IELTS band score by 1-2 points in under a month with our premium plan!
Note: Both the topic and the answer were created by one of our users.
The line graph compares six different countries (Finland, Denmark, France, Germany, the US, and the UK) in terms of their energy use as a share of total energy consumption between 1971 and 2006.
Overall, a sustainable energy usage as a proportion of total energy use witnessed a noticeable increase almost all the given countries with the exception of Finland which is remained unchanged from 1971 to 2006. Of particular note is United States which experienced a dramatic rise over the given period.
When it comes to slight growths in question, green energy consumption in Denmark stood at 15%, while this figure for France was about 8% in 1971. Between 1971 and 2006, sustainable energy usage in Denmark fluctuated noticeably before increasing to around 18% at the end of the period. There was a similar upward trend in France’s renewable energy consumption, which grew markedly from approximately 8% to 15% over the period. At the same time, sustainable energy use in Finland shows visible fluctuation before remaining unchanged in the final year.
Turning to the considerable rises, green energy consumption in the US grew from around 2% to about 19% with some fluctuations throughout the whole period, whereas renewable energy usage in Germany and the UK also increased from 5% and about 1% to roughly 14% and 6% over an 35-year period respectively.
Tekshirib ber va bahola
Word Count: 226
