Our system will evaluate the answer based on this AI-generated description.
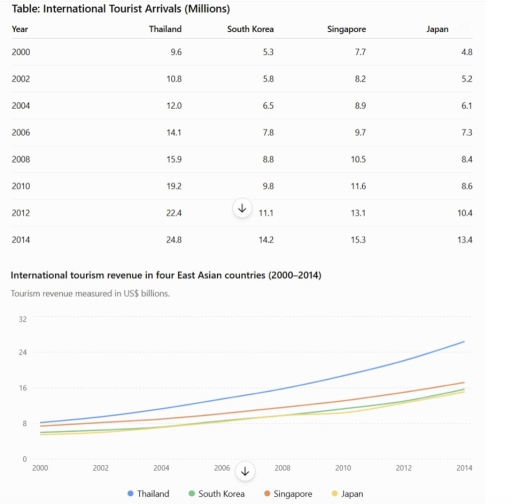
The image contains a table titled 'International Tourist Arrivals (Millions)' and a line graph titled 'International tourism revenue in four East Asian countries (2000–2014)' measured in US$ billions. The table data for arrivals is as follows: in 2000, Thailand 9.6, South Korea 5.3, Singapore 7.7, Japan 4.8; in 2002, Thailand 10.8, South Korea 5.8, Singapore 8.2, Japan 5.2; in 2004, Thailand 12.0, South Korea 6.5, Singapore 8.9, Japan 6.1; in 2006, Thailand 14.1, South Korea 7.8, Singapore 9.7, Japan 7.3; in 2008, Thailand 15.9, South Korea 8.8, Singapore 10.5, Japan 8.4; in 2010, Thailand 19.2, South Korea 9.8, Singapore 11.6, Japan 8.6; in 2012, Thailand 22.4, South Korea 11.1, Singapore 13.1, Japan 10.4; and in 2014, Thailand 24.8, South Korea 14.2, Singapore 15.3, Japan 13.4. The line graph shows approximate tourism revenue in 2000 as: Thailand ~US$8B, Singapore ~US$8B, South Korea ~US$7B, and Japan ~US$5B. By 2014, the approximate revenues were: Thailand ~US$28B, Singapore ~US$17B, Japan ~US$15B, and South Korea ~US$14B.
Given the complexity of the image, the above description may not be entirely accurate.
Skyrocket your IELTS band score by 1-2 points in under a month with our premium plan!
Note: Both the topic and the answer were created by one of our users.
The table and line graph illustrate differene between the number of international tourists and money earned from tourism in four East Aian countries between 2000 and 2014.
Overall, all four countries experienced significant growth. Thailand recorded the highest number of tourist arrivals, and it also generated the highest tourism revenue. In contrast, Japan had the lowest figure at the beginning, but it increased considerably at the end.
According to the table, Thailand experienced a significant rise in international tourist arrivals, from 9.6 million in 2000 to 24.8 million by 2014, making it the leader among other countries. South Korea also experienced steady growth, increasing from 5.3 in 2000 to 14.2 by 2014. Similarly, Singapore saw a gradual increase, starting with 7.7 million and ending with 15.3. By comparison, Japan showed a slightly rise, moving from 4.8 to 13.4, however it remained the lowest number.
Turning to the graph, Thailand again saw the biggest increase, going up from around $8 billion to over $26 billion. The other three countries followed a similar upward trend. Singapore remained second, rising its earnings from approximately $7 billion to $17 billion. South Korea and Japan started at the bottom, but ended close together at about $15 billion and $16 billion by 2014.
Word Count: 207
