🔥 Today Only: Save 30% on Premium — Offer Ends Soon! - Upgrade Now!
Table

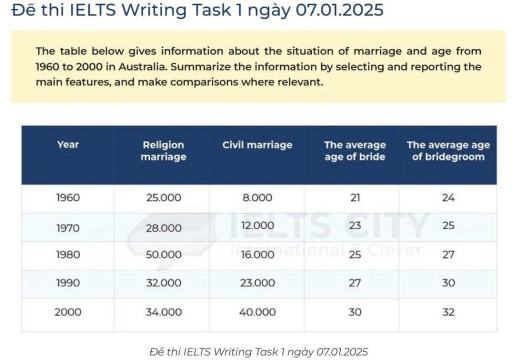
Band 7+: The table below gives information about the situation of marriage and age from 1960 to 2000 in Australia. Summarise the information by selecting and reporting the main features, and make comparisons where relevant.

Image for topic: The table below gives information about the situation of marriage and age from 1960 to 2000 in Australia. Summarise the information by selecting and reporting the main features, and make comparisons where relevant.
Our system will evaluate the answer based on this AI-generated description.
The image features a table with five column headers: "Year", "Religion marriage", "Civil marriage", "The average age of bride", and "The average age of bridegroom". The data rows for each year are as follows: for 1960, Religion marriage is 25.000, Civil marriage is 8.000, The average age of bride is 21, and The average age of bridegroom is 24; for 1970, Religion marriage is 28.000, Civil marriage is 12.000, The average age of bride is 23, and The average age of bridegroom is 25; for 1980, Religion marriage is 50.000, Civil marriage is 16.000, The average age of bride is 25, and The average age of bridegroom is 27; for 1990, Religion marriage is 32.000, Civil marriage is 23.000, The average age of bride is 27, and The average age of bridegroom is 30; for 2000, Religion marriage is 34.000, Civil marriage is 40.000, The average age of bride is 30, and The average age of bridegroom is 32.
Given the complexity of the image, the above description may not be entirely accurate.
Note: Both the topic and the answer were created by one of our users.

The table illustrates the situation of religion and civil marriage, age of bride and groom in Australia over a 40-year period between 1960 and 2000.

Overall, it is clear that the number of civil marriages rose steadily, while religion marriages experienced growth with a slight fluctuation throughout the period. Notably, although in the beginning of the period the average ages of bride and groom was 21 and 24, by the end it became 30 and 32, which means it climbed.

Turning to the details, the number of religious marriages stood at 25000 in 1960. After that it increased moderately by 1980, before doubling to 50000 over the following decade. Then, there was a significant decline to 32000 by 1990 after which it went up negligibly by the end of the period.

Furthermore, the figure of marriage in civil experienced a surge from approximately 8000 to 40000 throughout the entire period.

In addition, brides got married at the age of about 21,whereas grooms got married at nearly 24 in 1960 . Subsequently, the average ages of bride and groom advanced noticeably to 30 and 32 by 2000.

Word Count: 186

Answers On The Same Topic:

The table below gives information about the situation of marriage and age from 1960 to 2000 in Australia. Summarise the information by selecting and reporting the main features, and make comparisons where relevant.

The table illustrates information about the situation of marriage and age in Australia over a 40-year period between 1960 and 2000. Overall, it is clear that the number of religious marriages fluctuated while civil marriage experienced an upward trend over the period. In addition, the average age of both bride and groom increased significantly from […]

The table below gives information about the situation of marriage and age from 1960 to 2000 in Australia. Summarise the information by selecting and reporting the main features, and make comparisons where relevant.

The table illustrates information about the situation of marriage and age in Australia over a 40-year period between 1960 and 2000. Overall, it is clear that the number of religious marriages fluctuated while civil marriage experienced an upward trend over the period. In addition, the average age of both bride and groom increased significantly from […]

The table below gives information about the situation of marriage and age from 1960 to 2000 in Australia. Summarise the information by selecting and reporting the main features, and make comparisons where relevant.

The table compares the situation of marriage and average age of each person in the couple in Australia in the period from 1960 to 2000. It can be seen that the number of couple in civil marriage had went up sharply, becoming the highest figure at the end while the remaining married group, which had […]

The table below gives information about the situation of marriage and age from 1960 to 2000 in Australia. Summarise the information by selecting and reporting the main features, and make comparisons where relevant.

The table depicts details about the circumstance of the wedding and the appropriate age between the years 1960 and 2000 in Australia. Overall, the information includes religion marriage, civil marriage, and age of the bride and bridegroom with gaps of 10 years. Moreover, during the year 1980, the highest number of weddings was observed in […]

See All

Other Topics:

The table below shows the information about the posts held by women in parliament and in management in 5 countries in 2000. Summarise the information by selecting and reporting the main features and make comparisons where relevant.

The given table illustrates the percentages of seats available for women as government leaders and managers in five different countries namely Canada, Norway, Trinidad and Tobago, Uruguay, and Italy in 2000. Overall, it is evident that Norway accounted the largest proportion of government positions for women, whereas Italy recorded the highest percentage of managerial positions, […]

The table below shows how the UK unemployed spent their time last year. Summarise the information by selecting and reporting the main features, and make comparisons where relevant.You should write at least 150 words.

The given table illustrates how the UK unemployed individuals spent their time in different types of activity in the last year. overall, housework was most common work among the men and women; in contrast, drinking least common activity for them. In the moning, males were very active at job hunting, the proportion 22 percent was […]

The table below shows the number of male and female factory workers, together with the total workforce and the number of factories in England and Wales between 1851 and 1901.

The table shows the number of female and male workers, total employees, and factories in England and Wales from 1851 to 1901. Overall, the number of male and female employees declined concededly throughout the period. While the number of factories increased during the time. In terms of 1851 to 1871, in 225 factories, the number […]

The table below shows the results of a 2008 survey on undergraduate and postgraduate students' satisfaction with three university facilities in the UK.

The table compares in the results of a survey on undergraduate and postgraduate students’ satisfaction with three different university facilities in the UK in 2008. In general, study facility students recorded the highest percentage of very satisfied among both undergraduate and postgraduate students, while study facilities postgraduate took the lowest percentage of dissatisfied among the […]

The table below shows the results of a 2008 survey on undergraduate and postgraduate students' satisfaction with three university facilities in the UK.

The table illustrates the results of a survey conducted in 2008 about undergraduate and postgraduate students’ satisfaction with three university facilities in the UK. Overall, it is clear that study facilities received the highest levels of satisfaction, while the cafeteria was the least popular facility among both groups of students. Looking at undergraduate students, 85% […]

See All
We have detected unusual activity on your device.
Please verify your identity to continue.
Note: This verification step won't sign you in. If you have a premium account, please log in to access the service as usual.
Google/Gmail Verification
Or verify using Email/Code
We've sent a verification code to:
youremail@gmail.com (Not your email?)
Enter it below to complete the verification process.
Ensure your email address is correct, your inbox is not full, and you check your spam folder. If no email arrives, consider using an alternative email.
You will need a Premium plan to perform your action!
Note: If you already have a premium account, please log in to access our services as usual.

Plans & Pricing

Our mission is to make quality education accessible for everyone.
However, to keep our hardworking team running and this service alive, we genuinely need your support!
By opting for a premium plan, not only do you sustain us in achieving the mission, but you also unlock advanced features to enrich your learning experience.

Free

For learners who aren't pressed for time

What's included on Free
100+ Cambridge IELTS Tests
Instant IELTS Writing Task 1 & 2 Evaluation (2 times/month)
Instant IELTS Speaking Part 1, 2, & 3 Evaluation (2 times/month)
Instant IELTS Writing Task 1 & 2 Essay Generator (2 times/month)
500+ Dictation & Shadowing Exercises
100+ Pronunciation Exercises
Flashcards
Other Advanced Tools

Premium

For those serious about advancing their English proficiency, and for IELTS candidates aspiring to boost their band score by 1-2 points (especially in writing & speaking) in just 30 days or less

What's included on Premium
Save Your IELTS Test Progress & Analyze Mistakes By Question Type
Save Your Own Flashcard Sets & Use Them On Any Device
Unlock All Courses, IELTS Tests, Section & Part Practice
Unlimited AI Conversations
Unlimited AI Writing Enhancement Exercises
Unlimited IELTS Writing Task 1 & 2 Evaluation
Unlimited IELTS Speaking Part 1, 2, & 3 Evaluation
Checked Answers Will Not Be Published
Unlimited IELTS Writing Task 1 & 2 Essay Generator
Unlimited IELTS Speaking Part 1, 2, & 3 Sample Generator
Unlimited Usage Of Advanced Tools & AI Features
Priority Support within 24h (12-month plan only)

Due to the nature of our service and the provided free trials, payments are non-refundable.