🔥 Today Only: Save 30% on Premium — Offer Ends Soon! - Upgrade Now!
Table

Band 5+: The table below provides information about the Indians' perception of AI usage in both urban and rural areas in 2024. Summarise the information by selecting and reporting the main features, and make comparisons where relevant.

Image for topic: The table below provides information about the Indians' perception of AI usage in both urban and rural areas in 2024. Summarise the information by selecting and reporting the main features, and make comparisons where relevant.
Our system will evaluate the answer based on this AI-generated description.
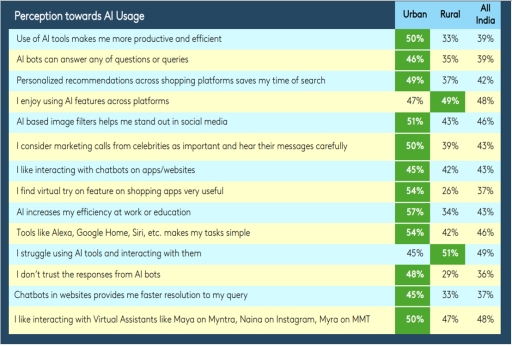
The image presents a table titled "Perception towards AI Usage" with columns for "Urban", "Rural", and "All India". Data points are: "Use of AI tools makes me more productive and efficient": Urban 50%, Rural 33%, All India 39%; "AI bots can answer any of questions or queries": Urban 46%, Rural 35%, All India 39%; "Personalized recommendations across shopping platforms saves my time of search": Urban 49%, Rural 37%, All India 42%; "I enjoy using AI features across platforms": Urban 47%, Rural 49%, All India 48%; "AI based image filters helps me stand out in social media": Urban 51%, Rural 43%, All India 46%; "I consider marketing calls from celebrities as important and hear their messages carefully": Urban 50%, Rural 39%, All India 43%; "I like interacting with chatbots on apps/websites": Urban 45%, Rural 42%, All India 43%; "I find virtual try on feature on shopping apps very useful": Urban 54%, Rural 26%, All India 37%; "AI increases my efficiency at work or education": Urban 57%, Rural 34%, All India 43%; "Tools like Alexa, Google Home, Siri, etc. makes my tasks simple": Urban 54%, Rural 42%, All India 46%; "I struggle using AI tools and interacting with them": Urban 45%, Rural 51%, All India 49%; "I don't trust the responses from AI bots": Urban 48%, Rural 29%, All India 36%; "Chatbots in websites provides me faster resolution to my query": Urban 45%, Rural 33%, All India 37%; "I like interacting with Virtual Assistants like Maya on Myntra, Naina on Instagram, Myra on MMT": Urban 50%, Rural 47%, All India 48%.
Given the complexity of the image, the above description may not be entirely accurate.
Note: Both the topic and the answer were created by one of our users.

The table shown the Indian’s puplic perceptions towards Artificial Intelligence in urban and rural side in the year of 2024.

Overall, cities acceptance percent is always at or on 45%, experience a positive rate at most categories compare to the countryside. Notably, there 2 statistics that being dominated by the rural which is the “I enjoy using AI features across platforms” and the “I struggle using AI tools anf interacting with them”.

Regarding the 57% in the urban and 34% in the rural which also the highest responded, many people say that an itergration of AI into personal and academic life brings significant efficency. Similarily, virtual try on feature gained 54 percent of urbans Indians and 42% of the countryside. Home assistants also favoured by many individuals as it simplified daily tasks through devices such as Alexa or Siri (50% versus 47%).

In contrast, 51% Indian rural responders are struggle with using AI, compared with 45% of city users. Notwithstanding, a more strong agreement with AI features across platforms are shown by rural residents at 49% and 47%, respectively.

Word Count: 179

Other Topics:

the table below shows the percentage of household and electronic goods in New Zealand in 2002 and 2020. summerize the information and make comparisons

The table compares the ownership percentages of seven different household and electronic devices in New Zealand in two specific years: 2002 and 2020. Overall, ownership of almost all listed electronic items increased over the 18-year period. Cell phones and digital cameras witnessed the most dramatic growth, while video recorders were the sole product to experience […]

The table shows the percentage of women in the workforce and management across five countries. Summarise the information by selecting and reporting the main features, and make comparisons where relevant.

The table shows the percentage of women in the workforce and management across five countries. Overall, Australia and the United States had the highest proportion of women in management. The proportion of women in workforce was highest in Japan. However, Sri Lanka and Egypt reported the lowest percentage of women in management. Out of five […]

The table shows the price of a cup of coffee in six cities in Australia from 2010 to 2014. Summarise the information by selecting and reporting the main features and make comparisons when relevant.

The given table demonstrates the cost of a cup of coffee in different Australian cities: Canberra, Melbourne, Brisbane, Sydney, Adelaide, Perth in four years period of time from 2010 to 2014. Overall, the price of one cup of coffee in Melbourne is significantly increased while, Canberra’s cup of coffee was slightly increased. In contrast, Brisbane’s […]

The tables below give information about sales of Fairtrade*-labelled tea and pineapples in 2010 and 2015 in five European countries.

The provided tables illustrates data regarding Fairtrade labelled tea and pineapples sales in the years 2010 and 2015 in five European countries. Overall, it is conspicuous that tea sales increased in mentioned European countries, while the trade of pineapples varied in countries. However, most contries experienced increasing sales of pineapples except Norway and Germany. Turning […]

The table illustrate proportion of people participating in leisure activities by three selected age groups.

The provided table showcases various activities people of different ages do in their free time in the last four weeks. Overall, consuming media via TV or DVDs is the most popular activity out of all given ones in all three age groups, whereas the smallest proportion of people enjoy dressmaking, needlework, and knitting. First of […]

The table below shows the average weekly salaries of men and of women working indifferent occupations

The table illustrates weekly wage of men and of women working in five different professions in 2015. Overall, male workers earned higher average weekly salaries than female workers across every single listed category. Additionally, professional roles yielded the highest income for both genders, whereas manual labor recorded the lowest overall earnings. Looking at the highest-paid […]

See All
We have detected unusual activity on your device.
Please verify your identity to continue.
Note: This verification step won't sign you in. If you have a premium account, please log in to access the service as usual.
Google/Gmail Verification
Or verify using Email/Code
We've sent a verification code to:
youremail@gmail.com (Not your email?)
Enter it below to complete the verification process.
Ensure your email address is correct, your inbox is not full, and you check your spam folder. If no email arrives, consider using an alternative email.
You will need a Premium plan to perform your action!
Note: If you already have a premium account, please log in to access our services as usual.

Plans & Pricing

Our mission is to make quality education accessible for everyone.
However, to keep our hardworking team running and this service alive, we genuinely need your support!
By opting for a premium plan, not only do you sustain us in achieving the mission, but you also unlock advanced features to enrich your learning experience.

Free

For learners who aren't pressed for time

What's included on Free
100+ Cambridge IELTS Tests
Instant IELTS Writing Task 1 & 2 Evaluation (2 times/month)
Instant IELTS Speaking Part 1, 2, & 3 Evaluation (2 times/month)
Instant IELTS Writing Task 1 & 2 Essay Generator (2 times/month)
500+ Dictation & Shadowing Exercises
100+ Pronunciation Exercises
Flashcards
Other Advanced Tools

Premium

For those serious about advancing their English proficiency, and for IELTS candidates aspiring to boost their band score by 1-2 points (especially in writing & speaking) in just 30 days or less

What's included on Premium
Save Your IELTS Test Progress & Analyze Mistakes By Question Type
Save Your Own Flashcard Sets & Use Them On Any Device
Unlock All Courses, IELTS Tests, Section & Part Practice
Unlimited AI Conversations
Unlimited AI Writing Enhancement Exercises
Unlimited IELTS Writing Task 1 & 2 Evaluation
Unlimited IELTS Speaking Part 1, 2, & 3 Evaluation
Checked Answers Will Not Be Published
Unlimited IELTS Writing Task 1 & 2 Essay Generator
Unlimited IELTS Speaking Part 1, 2, & 3 Sample Generator
Unlimited Usage Of Advanced Tools & AI Features
Priority Support within 24h (12-month plan only)

Due to the nature of our service and the provided free trials, payments are non-refundable.