🔥 Today Only: Save 30% on Premium — Offer Ends Soon! - Upgrade Now!
Table

Band 7+: The table shows the average length of YouTube video advertisements and an average length of time viewers spend watching them.

Image for topic: The table shows the average length of YouTube video advertisements and an average length of time viewers spend watching them.
Our system will evaluate the answer based on this AI-generated description.
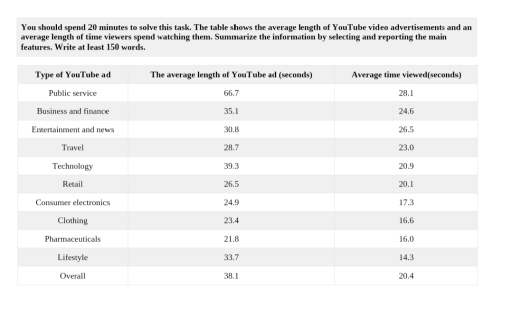
The image displays a table listing various types of YouTube ads alongside their average lengths in seconds and the average time viewed in seconds. Public service ads have an average length of 66.7 seconds and are viewed for 28.1 seconds. Business and finance ads last 35.1 seconds and are viewed for 24.6 seconds. Entertainment and news ads average 30.8 seconds with 26.5 seconds of viewing. Travel ads are 28.7 seconds long and viewed for 23.0 seconds. Technology ads last 39.3 seconds, with 20.9 seconds of viewer attention. Retail ads are 26.5 seconds long with a 20.1-second viewing. Consumer electronics ads last 24.9 seconds and are watched for 17.3 seconds. Clothing ads average 23.4 seconds in length and 16.4 seconds in viewing. Pharmaceuticals ads are 21.8 seconds with 16.0 seconds viewed. Lifestyle ads are 33.7 seconds long with 14.3 seconds of viewing. Overall, ads average 38.1 seconds in length and 20.4 seconds viewed.
Given the complexity of the image, the above description may not be entirely accurate.
Note: Both the topic and the answer were created by one of our users.

Illustrated by the table are the average length of video advertisements on the internet and the average time viewer watching ads, measured in seconds.

Overall, it is evident that a public service has the longest time in length of advertisements and time viewed by viewers. Furthermore, the average length of advertisement has more time used than time watched, suggesting that the internet’s users tend to skip ads before they finish.

In the average length of ads, the public service account for 45.8, which is significantly higher than any other types. Following this, an entertainment and an automotive have the similarity of time, showing at 27.8 and 27.2, respectively. Moreover, other retail and financial services only represent below twenty two seconds, at 21.0 and 20.5 each. Meanwhile, the remaining categories have produced advertisements around 19-14.

Turning into average time viewed, the ads from public service have been viewed within 18.5. People also devote their time in financial services, spending 16.3. Additionally, the automotive, travel, entertainment, and home furnishings are watched by people around 13-10. In contrast, several categories are only viewed approximately 8-4, with other retail having the lowest figures.

Word Count: 189

Answers On The Same Topic:

The table shows the average length of YouTube video advertisements and an average length of time viewers spend watching them.

The table compares the average time length of youtube advertisements of ten different categories with the average amount of time viewers spend wacthing them, with all figures mesuared in seconds. Overall, public service remained the longest advirtisements and most wacthed among all others. In addition, most categories ad types wacthed for considerable less time than […]

The table shows the average length of YouTube video advertisements and an average length of time viewers spend watching them.

The table compares the average length of different types of YouTube advertisements and the average amount of time viewers spend watching them. Overall, public service advertisements are the longest and receive the highest viewing time. In addition, viewers usually watch only part of most advertisements, while lifestyle ads attract the lowest average viewing time despite […]

The table shows the average length of YouTube video advertisements and an average length of time viewers spend watching them.

The table compares the average length of different types of YouTube advertisements and the average amount of time viewers spend watching them. Overall, public service advertisements are the longest and also attract the highest viewing time. In contrast, lifestyle advertisements have relatively long durations but the lowest audience retention. Another noticeable feature is that viewers […]

The table shows the average length of YouTube video advertisements and an average length of time viewers spend watching them.

The table illustrate the average length of Youtube video advertisement and an average length of time viewers spend watching them. Overall, 38.1 is the typical length of Youtube advertisement, which people averagely would spend 20.4 seconds watching them. Regarding the Youtube ad’s length, public and service is the dominant in this field, which accounts for […]

See All

Other Topics:

The chart shows the distance covered in various modes of transport.

The chart illustrates the travel covered in several modes of conveyance. Overall, it is the distance chart travelled per person per anum by various transports in two different years. In the first year people covered longest distance by car. However, in the other year public travelled shortest distance through bicycle. To begin with, every person […]

The table shows how patients evaluated different services at three health centres. Summarise the information by selecting and reporting the main features, and make comprasinos where relevant.

According the infotmation in that table on “How patients evalueted health centre services”. Summarise the information, I have found some data on the subjects and then I am going to analyze this table. The table show us the Peveril Centre has scored 8.3 overall awerage of interviewed, also we have some data about the Longston […]

The table below gives information related to population growth, average birth per woman, and life expectancy at birth in countries with different income levels in 2002 and 2004. Summarise the information making comparisons where relevant.

The table compares population growth, the average number of births per woman, and life expectancy at birth in high, middle and low income countries in 2002 and 2004. Overall, population growth and average number of births either fell slightly or remained unchanged in all three groups, while life expectancy at birth rose by a similar […]

The graph below shows the percentage of people unemployed in the total labour work force across 9 countries in 1994 and 2004. Summarise the information by selecting and reporting the main features, and make comparisons where relevant.

The table compares the unemployment rates in the labour force across nine countries in 1994 and 2004. Overall, most of the countries surveyed experienced declines in their unemployment rates over the ten-year period, while Poland, Germany, Australia and Japan recorded increases. Ireland saw by far the steepest decline, falling from the highest unemployment rate in […]

The bar chart below shows the number of students who sose differenf university subject in 2024.

The given pie charts indicates the chooses of several subjects in 2010 and 2025. Overall, despite the constant decline, business overwhelmingly dominated the subjects of university throughout the timeframes while art serving as the least common choice in 2 periods of years. The most noticeable chooses subject is business. In 2010, business subject complete 25%. […]

See All
We have detected unusual activity on your device.
Please verify your identity to continue.
Note: This verification step won't sign you in. If you have a premium account, please log in to access the service as usual.
Google/Gmail Verification
Or verify using Email/Code
We've sent a verification code to:
youremail@gmail.com (Not your email?)
Enter it below to complete the verification process.
Ensure your email address is correct, your inbox is not full, and you check your spam folder. If no email arrives, consider using an alternative email.
You will need a Premium plan to perform your action!
Note: If you already have a premium account, please log in to access our services as usual.

Plans & Pricing

Our mission is to make quality education accessible for everyone.
However, to keep our hardworking team running and this service alive, we genuinely need your support!
By opting for a premium plan, not only do you sustain us in achieving the mission, but you also unlock advanced features to enrich your learning experience.

Free

For learners who aren't pressed for time

What's included on Free
100+ Cambridge IELTS Tests
Instant IELTS Writing Task 1 & 2 Evaluation (2 times/month)
Instant IELTS Speaking Part 1, 2, & 3 Evaluation (2 times/month)
Instant IELTS Writing Task 1 & 2 Essay Generator (2 times/month)
500+ Dictation & Shadowing Exercises
100+ Pronunciation Exercises
Flashcards
Other Advanced Tools

Premium

For those serious about advancing their English proficiency, and for IELTS candidates aspiring to boost their band score by 1-2 points (especially in writing & speaking) in just 30 days or less

What's included on Premium
Save Your IELTS Test Progress & Analyze Mistakes By Question Type
Save Your Own Flashcard Sets & Use Them On Any Device
Unlock All Courses, IELTS Tests, Section & Part Practice
Unlimited AI Conversations
Unlimited AI Writing Enhancement Exercises
Unlimited IELTS Writing Task 1 & 2 Evaluation
Unlimited IELTS Speaking Part 1, 2, & 3 Evaluation
Checked Answers Will Not Be Published
Unlimited IELTS Writing Task 1 & 2 Essay Generator
Unlimited IELTS Speaking Part 1, 2, & 3 Sample Generator
Unlimited Usage Of Advanced Tools & AI Features
Priority Support within 24h (12-month plan only)

Due to the nature of our service and the provided free trials, payments are non-refundable.