🔥 Today Only: Save 30% on Premium — Offer Ends Soon! - Upgrade Now!
Table

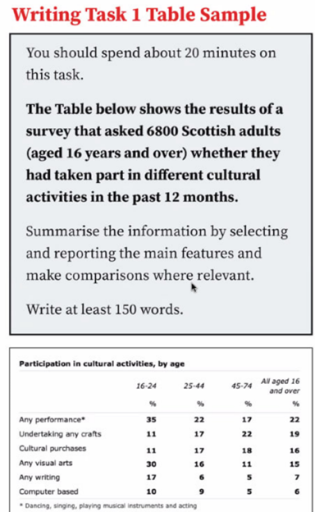
Band 4+: The table shows the results of a survey that asked 6800 Scottish adults (aged 16 years and over) whether they had taken part in different cultural activities in the past 12 months.

Image for topic: The table shows the results of a survey that asked 6800 Scottish adults (aged 16 years and over) whether they had taken part in different cultural activities in the past 12 months.
Our system will evaluate the answer based on this AI-generated description.
The image is a screenshot of a Writing Task 1 sample prompt, instructing the test-taker to spend 20 minutes summarizing a table that shows the results of a survey conducted on 6800 Scottish adults aged 16 years and over, about their participation in cultural activities in the past 12 months. The table is titled "Participation in cultural activities, by age" and has four age groups (16-24, 25-44, 45-64, and All aged 16 and over) with eight categories of cultural activities listed, including "Any performance," "Undertaking any crafts," "Any visual arts," "Cultural purchases," "Any writing," "Computer based," "Dancing, singing, playing musical instruments," and "Visiting based." Each category has a percentage of participation for each age group, with the highest participation overall being in "Any performance" (22% for ages 25-44 and All aged 16 and over). The lowest participation is in "Computer based" (5% for ages 45-64 and 6% for All aged 16 and over). The task requires a minimum of 150 words.
Given the complexity of the image, the above description may not be entirely accurate.
Note: Both the topic and the answer were created by one of our users.

The table illustrates the results of a survey that asked 6800 Scottish adults (ages 16 years and over) whether they had taken part unsimilar cultural activities in the past 1 year.

Overall, it is clearly seem that 16 and 24 ages spent time more activities than other group ages.

In between 16 and 24 ages groups spent any performance achieve 35% furthermore undertaking any crafts accounts for 11%. Curtural purchases persentage similar makes up 11%. Any visual arts account for 30%. Any writing and computer based makes up 17% and 10%. In 25-44 Age groups spent 22% on any performance and undertaking any crafts respectively 17%. In addition account for 17% with cuitural purchases. Any visual arts percentage achieved 16%. Any writing and Computer based spend percentage 6%-9%.

In 45-74 ages groups spent any performance to 17%. Undertaking and cultural purchases makes up 22% and 18%. Moreover any visual arts achieved 11%. In addition any writing and computer based account for similar 5% in the both activities. All aged 16 and over spent activities percent, any performance makes up 22% and undertaking any crafts at 19%. Cultural purchases and any visual arts accounts for 16% and 15%. The ends activities any writing and computer based achieved 7 and 6%.

Word Count: 209

Answers On The Same Topic:

The table shows the results of a survey that asked 6800 Scottish adults (aged 16 years and over) whether they had taken part in different cultural activities in the past 12 months.

The table illustrates the outcome of a survey in Scottish that 6800 younger people had different cultural activities in the past year. Overall, it can be clearly seen that the highest percentage of people activities was any performance, while computer based had the lowest participation in cultural events, by age, throughout the months. In terms […]

The table shows the results of a survey that asked 6800 Scottish adults (aged 16 years and over) whether they had taken part in different cultural activities in the past 12 months.

The table provides information on the percentage of Scottish adults, aged 16 and above, who participated in various cultural activities over the past 12 months, categorized by age group. Overall, it is clear that younger people were more likely to engage in active performances and visual arts, whereas older demographics preferred crafts and cultural purchases. […]

The table shows the results of a survey that asked 6800 Scottish adults (aged 16 years and over) whether they had taken part in different cultural activities in the past 12 months.

The table chart provides information about the participation in cultural activities in four different age groups in the past 12 months. Overall, people aged 16 and 24 experienced the highest share for any performance, whereas computer based activities had the least percentage. In terms of any performance, the percentage of the 16-24 aged groups represented […]

The table shows the results of a survey that asked 6800 Scottish adults (aged 16 years and over) whether they had taken part in different cultural activities in the past 12 months.

The given table shows the past year’s result of the cultural activities participation survey passed for adults aged over 16 in Scotland, introduced percentage-wise. At first glance, it is clear that the group of people aged 16 to 24 introduced the dominating figures in most categories. Moreover, “any performance” events were the most attended for […]

See All

Other Topics:

WRITING TASK 1 You should spend about 20 minutes on this task. The first table below shows changes in the total population of New York City from 1800 to 2000. The second and third tables show changes in the population of the five districts of the city (Manhattan, Brooklyn, Bronx, Queens, Staten Island) over the same period. Summarise the information by selecting and reporting the main features, and make comparisons where relevant. Write at least 150 words

The tables illustrate population change in New York city in overall and its five districts, Manhattan, Brooklyn, Bronx, Queens and Staten Island over a period of two hundred years. It is clear that Manhattan was the most populated district in the years 1800 and 1900, hosting more than 50% of citizens. However, other four districts […]

The table shows consumer expenses on distinct items—tobacco, footwear, and education—in five different countries in 2002.

the table presents customers spending on tobbaco and food , clothing and shoes , leisure and educational activities in several nations in 2022. Overall, it is evident that tobacco accounted for the largest proportion of consumer expenditure in most of the countries, whereas education represented a comparatively smaller share. Footwear expenditure, meanwhile, occupied an intermediate […]

the table below shows the percentage of household and electronic goods in New Zealand in 2002 and 2020. summerize the information and make comparisons

The table compares the ownership percentages of seven different household and electronic devices in New Zealand in two specific years: 2002 and 2020. Overall, ownership of almost all listed electronic items increased over the 18-year period. Cell phones and digital cameras witnessed the most dramatic growth, while video recorders were the sole product to experience […]

The table shows the percentage of women in the workforce and management across five countries. Summarise the information by selecting and reporting the main features, and make comparisons where relevant.

The table shows the percentage of women in the workforce and management across five countries. Overall, Australia and the United States had the highest proportion of women in management. The proportion of women in workforce was highest in Japan. However, Sri Lanka and Egypt reported the lowest percentage of women in management. Out of five […]

The table shows the price of a cup of coffee in six cities in Australia from 2010 to 2014. Summarise the information by selecting and reporting the main features and make comparisons when relevant.

The given table demonstrates the cost of a cup of coffee in different Australian cities: Canberra, Melbourne, Brisbane, Sydney, Adelaide, Perth in four years period of time from 2010 to 2014. Overall, the price of one cup of coffee in Melbourne is significantly increased while, Canberra’s cup of coffee was slightly increased. In contrast, Brisbane’s […]

The tables below give information about sales of Fairtrade*-labelled tea and pineapples in 2010 and 2015 in five European countries.

The provided tables illustrates data regarding Fairtrade labelled tea and pineapples sales in the years 2010 and 2015 in five European countries. Overall, it is conspicuous that tea sales increased in mentioned European countries, while the trade of pineapples varied in countries. However, most contries experienced increasing sales of pineapples except Norway and Germany. Turning […]

See All
We have detected unusual activity on your device.
Please verify your identity to continue.
Note: This verification step won't sign you in. If you have a premium account, please log in to access the service as usual.
Google/Gmail Verification
Or verify using Email/Code
We've sent a verification code to:
youremail@gmail.com (Not your email?)
Enter it below to complete the verification process.
Ensure your email address is correct, your inbox is not full, and you check your spam folder. If no email arrives, consider using an alternative email.
You will need a Premium plan to perform your action!
Note: If you already have a premium account, please log in to access our services as usual.

Plans & Pricing

Our mission is to make quality education accessible for everyone.
However, to keep our hardworking team running and this service alive, we genuinely need your support!
By opting for a premium plan, not only do you sustain us in achieving the mission, but you also unlock advanced features to enrich your learning experience.

Free

For learners who aren't pressed for time

What's included on Free
100+ Cambridge IELTS Tests
Instant IELTS Writing Task 1 & 2 Evaluation (2 times/month)
Instant IELTS Speaking Part 1, 2, & 3 Evaluation (2 times/month)
Instant IELTS Writing Task 1 & 2 Essay Generator (2 times/month)
500+ Dictation & Shadowing Exercises
100+ Pronunciation Exercises
Flashcards
Other Advanced Tools

Premium

For those serious about advancing their English proficiency, and for IELTS candidates aspiring to boost their band score by 1-2 points (especially in writing & speaking) in just 30 days or less

What's included on Premium
Save Your IELTS Test Progress & Analyze Mistakes By Question Type
Save Your Own Flashcard Sets & Use Them On Any Device
Unlock All Courses, IELTS Tests, Section & Part Practice
Unlimited AI Conversations
Unlimited AI Writing Enhancement Exercises
Unlimited IELTS Writing Task 1 & 2 Evaluation
Unlimited IELTS Speaking Part 1, 2, & 3 Evaluation
Checked Answers Will Not Be Published
Unlimited IELTS Writing Task 1 & 2 Essay Generator
Unlimited IELTS Speaking Part 1, 2, & 3 Sample Generator
Unlimited Usage Of Advanced Tools & AI Features
Priority Support within 24h (12-month plan only)

Due to the nature of our service and the provided free trials, payments are non-refundable.