Our system will evaluate the answer based on this AI-generated description.
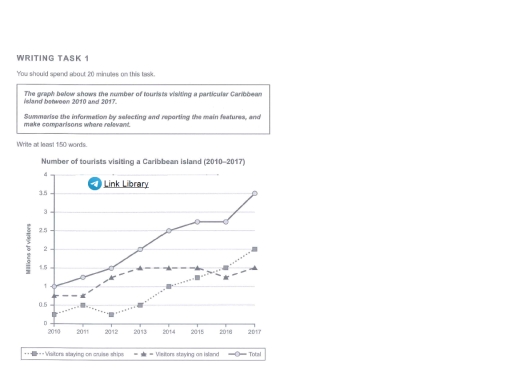
The image presents data detailing the number of tourists visiting a Caribbean island annually from 2010 to 2017, segmented between visitors staying on cruise ships and those staying on the island, with totals. In 2010: cruise ship visitors at 0.3 million, island visitors at 0.7 million, totaling 1 million; in 2011: cruise ship visitors at 0.5 million, island visitors at 0.7 million, totaling 1.2 million; in 2012: cruise ship visitors at 0.5 million, island visitors at 0.8 million, totaling 1.3 million; in 2013: cruise ship visitors at 0.6 million, island visitors at 1 million, totaling 1.6 million; in 2014: cruise ship visitors at 0.7 million, island visitors at 1.2 million, totaling 1.9 million; in 2015: cruise ship visitors at 1.3 million, island visitors at 1.3 million, totaling 2.5 million; in 2016: cruise ship visitors at 1.5 million, island visitors at 1.4 million, totaling 2.9 million; and in 2017: cruise ship visitors at 2 million, island visitors at 1.5 million, totaling 3.5 million.
Given the complexity of the image, the above description may not be entirely accurate.
Skyrocket your IELTS band score by 1-2 points in under a month with our premium plan!
Note: Both the topic and the answer were created by one of our users.
The line graph above depicts the number of travelers on a particular Caribbean island between 2010 and 2017.
Overall, the linear representation shows an increase in total visitors throughout the years. The visitors staying on the island mostly exhibit stable growth throughout the period with a higher total of tourists. Meanwhile, albeit possessing a generally lower volume, cruise ship dweller numbers surge at the end of the period.
The total number of tourists steadily goes upwards, gaining around 0.5 million annually. A larger segment of the total travelers are people staying on the island for most of the period. The category began with 0.8 million people, reaching its peak in 2013 with 1.5 million. However, the volume declined in 2016 as it lost 0.5 million visitors.
Conversely, those who stayed on the cruise ships had a slower growth, starting below 0.5 million visitors in 2010. Although the number of travelers gradually increased in 2011, it experienced a drop during 2012. After this decrease, visitor numbers for cruise ship passengers never stopped rising and reached its peak at 2 million visitors in 2017.
Word Count: 182
