🔥 Today Only: Save 30% on Premium — Offer Ends Soon! - Upgrade Now!
Line Graph

Band 5+: tourists visiting caribbean island and their preference of staying on island or cruise ships

Image for topic: tourists visiting caribbean island and their preference of staying on island or cruise ships
Our system will evaluate the answer based on this AI-generated description.
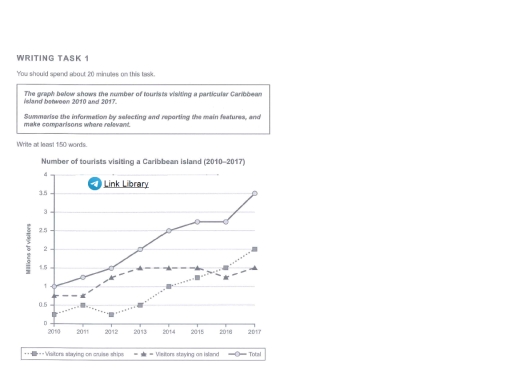
The image presents data detailing the number of tourists visiting a Caribbean island annually from 2010 to 2017, segmented between visitors staying on cruise ships and those staying on the island, with totals. In 2010: cruise ship visitors at 0.3 million, island visitors at 0.7 million, totaling 1 million; in 2011: cruise ship visitors at 0.5 million, island visitors at 0.7 million, totaling 1.2 million; in 2012: cruise ship visitors at 0.5 million, island visitors at 0.8 million, totaling 1.3 million; in 2013: cruise ship visitors at 0.6 million, island visitors at 1 million, totaling 1.6 million; in 2014: cruise ship visitors at 0.7 million, island visitors at 1.2 million, totaling 1.9 million; in 2015: cruise ship visitors at 1.3 million, island visitors at 1.3 million, totaling 2.5 million; in 2016: cruise ship visitors at 1.5 million, island visitors at 1.4 million, totaling 2.9 million; and in 2017: cruise ship visitors at 2 million, island visitors at 1.5 million, totaling 3.5 million.
Given the complexity of the image, the above description may not be entirely accurate.
Note: Both the topic and the answer were created by one of our users.

The given chart presents the amount of tourists visiting a specific Caribbean island from 2010 to 2017.

Overall, the total number of visitors has increased throughout the years, whereas the number of visitors staying on cruise ships and staying on the island have fluctuated.

Firstly, the number of visitors in the Caribbean island have increased from 1 millions to 3,5 millions in the period of 8 years. Regarding the visitors staying on cruise ships, the number has fluctuated, going from 0,3 million in 2010 to 0,5 millions in 2011. This number has slightly decreased back to 0,3 millions in 2012, before skyrocketing to 2 millions from 2013 to 2017. Lastly, the amount of visitors staying on the island has fluctuated, starting from 0,7 millions visitors from 2010 to 2011, slightly rising to 1,5 millions from 2012 to 2015. From 2015 to 2017, the number of visitors have fluctuated between 1,3 millions to 1,5 millions.

Word Count: 154

Answers On The Same Topic:

tourists visiting caribbean island and their preference of staying on island or cruise ships

The graph demonstrates the information about number of visitors travelled to a particular Caribbean island from 2010 to 2017. Overall, the total number of tourists visited to Caribbean island showed an upward trend. However, number of visitors stayed on cruise ships and on islands, both, depicted fluctuations throughout the period under consideration. In 2010, out […]

tourists visiting caribbean island and their preference of staying on island or cruise ships

The chart illustrates how much the number of tourists visiting the Caribbean island has changed over a 7-year period, from 2010 to 2017. Units are measured in millions of visitors. Overall, it is clear that while the number of tourists staying on cruise ships showed an upward trend, tourists staying on the island and the […]

tourists visiting caribbean island and their preference of staying on island or cruise ships

The line graph provide information about the number of visitors who went to a Carribean island and chose between two different accomodation types from 2010 to 2017. Overall, the number of travellers staying on a cruise ships or on the island had increased significantly over the time, resulting in a massive leap in the number […]

tourists visiting caribbean island and their preference of staying on island or cruise ships

The line graph illustrates the number of tourists who visited a Caribbean island between 2010 and 2017, categorised by their choice of accommodation—either staying on cruise ships or on the island itself. Figures are given in millions. Overall, there was a consistent increase in the total number of visitors throughout the period, rising from 1 […]

See All

Other Topics:

The graph below shows the rate of smoking per 1000 people in Someland from 1960 to 2000.

The given line graph compares the smoking rates of two genders in Someland, over a 40-year period, measured in per 1000 people. It is clearly illustrated that, although the figure for smoking males was higher than females at the start, this gap narrowed down towards the end of the survey and approximately overlapped with the […]

The table gives information on households with a regular use of a car in Great Britain from 1971 to 2007

The graph delineates the data on households with a daily use of a car in great britain in 1971 an 2007. As a result of industrialization proportion of households with no car declined.Conversely,households with one car plateued and completing the desrire of ownening two cars experiend a upward trend as proportion for this increased. Around […]

The graph below shows people's level of satisfaction with the health care system in 4 countries between 1991 and 2007.

The line graph illustrates the proportion of people satisfied with their healthcare systems in Canada, the Netherlands, the United Kingdom, and the United States across three time points: 1991, 1998, and 2006. Overall, the Netherlands maintained the highest satisfaction levels throughout the period, while the USA consistently recorded the lowest figures. Most countries experienced a […]

The graph below shows people's level of satisfaction with the health care system in 4 countries between 1991 and 2007.

The line graph illustrates the proportion of citizens’ statisfaction about medical care in specific coutries-Canada, Netherland, UK and USA- from 1991 to 2006. Overall, the chart shows significant shift in the percentage of pleasureness in Canada, experiencing a pronounced decline, despite peaking at the highest point in the initial year. Others, Netherland and UK, followed […]

The proportion of total expenditure in a specific European country between 1960 and 2000.

The graph dislpays the proportion of earning spend on different things for a european country from the year 1960 to 2000. Overall,every sector experienced a decline in share of the total expenditure,but transport was an exception as the proportion for it increased. Food dominated the figure with around 35% for the year 1960,followed by the […]

See All
We have detected unusual activity on your device.
Please verify your identity to continue.
Note: This verification step won't sign you in. If you have a premium account, please log in to access the service as usual.
Google/Gmail Verification
Or verify using Email/Code
We've sent a verification code to:
youremail@gmail.com (Not your email?)
Enter it below to complete the verification process.
Ensure your email address is correct, your inbox is not full, and you check your spam folder. If no email arrives, consider using an alternative email.
You will need a Premium plan to perform your action!
Note: If you already have a premium account, please log in to access our services as usual.

Plans & Pricing

Our mission is to make quality education accessible for everyone.
However, to keep our hardworking team running and this service alive, we genuinely need your support!
By opting for a premium plan, not only do you sustain us in achieving the mission, but you also unlock advanced features to enrich your learning experience.

Free

For learners who aren't pressed for time

What's included on Free
100+ Cambridge IELTS Tests
Instant IELTS Writing Task 1 & 2 Evaluation (2 times/month)
Instant IELTS Speaking Part 1, 2, & 3 Evaluation (5 times/month)
Instant IELTS Writing Task 1 & 2 Essay Generator (2 times/month)
500+ Dictation & Shadowing Exercises
100+ Pronunciation Exercises
Flashcards
Other Advanced Tools

Premium

For those serious about advancing their English proficiency, and for IELTS candidates aspiring to boost their band score by 1-2 points (especially in writing & speaking) in just 30 days or less

What's included on Premium
Save Your IELTS Test Progress
Unlock All Courses & IELTS Tests
Unlimited AI Conversations
Unlimited AI Writing Enhancement Exercises
Unlimited IELTS Writing Task 1 & 2 Evaluation
Unlimited IELTS Speaking Part 1, 2, & 3 Evaluation
Checked Answers Will Not Be Published
Unlimited IELTS Writing Task 1 & 2 Essay Generator
Unlimited IELTS Speaking Part 1, 2, & 3 Sample Generator
Unlimited Usage Of Advanced Tools
Priority Support within 24h (12-month plan only)

Due to the nature of our service and the provided free trials, payments are non-refundable.
Nếu bạn là người Việt Nam và không có hoặc không muốn trả bằng credit/debit cards, bạn có thể thanh toán bằng phương thức chuyển khoản:


Chọn gói:
419,000₫ 277,000 ₫ cho gói 1 tháng (chỉ 9,233₫/ngày)
1,239,000₫ 597,000 ₫ cho gói 3 tháng (chỉ 6,633₫/ngày)
2,469,000₫ 1,027,000 ₫ cho gói 6 tháng (chỉ 5,706₫/ngày)
4,929,000₫ 1,417,000 ₫ cho gói 12 tháng (chỉ 3,936₫/ngày)


Sau khi chuyển khoản, vui lòng đợi trình duyệt tự động điều hướng bạn trở lại Engnovate và bạn sẽ ngay lập tức nhận được mã kích hoạt tài khoản premium.
Nếu có lỗi xảy ra, bạn có thể liên hệ với team thông qua một trong các phương thức: email đến helloengnovate@gmail.com hoặc nhắn tin qua facebook.com/engnovate.
Vì toàn bộ công cụ trên website đều có thể sử dụng thử miễn phí, Engnovate không hỗ trợ hoàn tiền.