Our system will evaluate the answer based on this AI-generated description.
The image presents a line graph detailing the number of overseas visitors to the UK, categorized by purpose from 1989 to 2009. In 1989, business visitors numbered approximately 4 million, holiday visitors around 6 million, and those visiting friends and relatives roughly 2 million. By 1994, business visitors remained stable near 6 million, holiday visitors peaked at nearly 9 million, and visits to friends and relatives increased to approximately 3 million. In 1999, business visits rose slightly to 7 million, holidays declined to about 8 million, while visiting friends and relatives maintained 3 million. In 2004, business visits saw a slight decline to approximately 6 million, holidays increased to 8 million, with visits to friends and relatives rising to 4 million. Finally, in 2009, business visits climbed to 9 million, holiday visits returned to around 8 million, and those visiting friends and relatives increased slightly to around 6 million.
Given the complexity of the image, the above description may not be entirely accurate.
Skyrocket your IELTS band score by 1-2 points in under a month with our premium plan!
Note: Both the topic and the answer were created by one of our users.
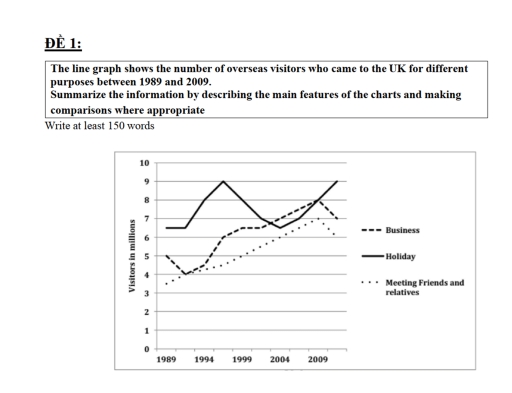
The line chart given compares three different purposes for visiting the UK based on the number of overseas visitors from 1989 to 2009, at five-year intervals.
Looking at the illustration, it is immediately evident that holidays recorded the highest figures in most years, whereas the opposite was true for meeting friends and relatives. Additionally, most purposes surveyed showed an upward trend. Overall, visitor numbers followed an upward trend in the given period, irrespective of the trip’s purpose, even as fluctuations could be seen at certain points in the 20-year time frame.
In 1989, the figure for people visiting the country for holidays dominated the chart at approximately 6.5 million visitors, which was roughly 1.5 million higher than those who visited for business purposes. Meanwhile, visiting friends and relatives had the lowest figure, at about 3.5 million. By 2004, business had overtaken holidays to become the most popular purpose for coming to the UK.
In 2009, despite a dramatic drop from 1999 to 2004, holidays still boasted the largest number of visitors and reached a peak of around 9 million visitors. The figures for both business and visiting friends and relatives purposes experienced a slight drop, to stand at 7 million and 6 million, respectively.
Word Count: 204