Our system will evaluate the answer based on this AI-generated description.
The image consists of two bar charts depicting computer ownership trends. The first chart shows computer ownership from 2002 to 2010, with the percentage of ownership increasing from approximately 58% in 2002 to around 76% in 2010, with notable increases approximately every two years. The second chart shows computer ownership by education level for both 2002 and 2010, with six categories: no high school diploma, high school graduate, some college (no diploma), college graduate, bachelor's degree, and postgraduate qualification. In 2002, the percentage of computer ownership for each category is roughly 20%, 60%, 75%, 83%, 86%, and 90%, respectively. In 2010, the percentages increase to approximately 40%, 80%, 90%, 94%, 96%, and 98%, respectively. The chart shows a correlation between higher education levels and increased computer ownership, with the most significant percentage increase occurring in the 'no high school diploma' category.
Given the complexity of the image, the above description may not be entirely accurate.
Skyrocket your IELTS band score by 1-2 points in under a month with our premium plan!
Note: Both the topic and the answer were created by one of our users.
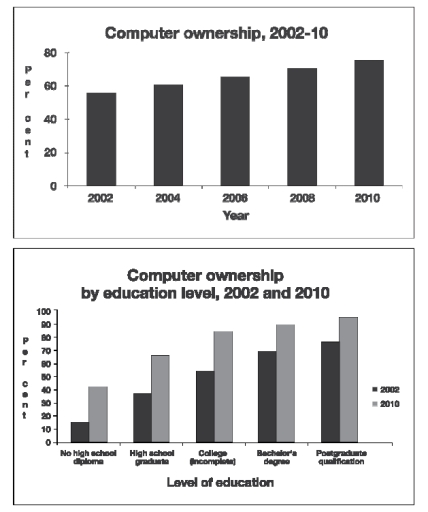
The first of the given graphs represents the percentages of people who owned computers between the years 2002 – 2010. The second graph, on the other hand, compares the education levels of people who owned computers in 2002 and 2010.
First of all, information from the first graph indicates that there had been a sequential rise in the percentages of computer owners over the 8 years. Hence, there had been an almost 20% increase in computer owners from 2002 to 2010.
From the other graph, it is clear that the percentages from 2010 surpass those of 2002. The largest percentage difference is observed among computer owners who are high school graduates, whereas the smallest percentage gap is among computer owners with postgraduate qualifications. Clearly, after almost a decade, the demand for computers in each field had increased, most prominently, the educational field.
In conclusion, the information at hand gives a general overview of the pattern of increased demand noticed for the computer over the span of 8 years.
Word Count: 168