🔥 Today Only: Save 30% on Premium — Offer Ends Soon! - Upgrade Now!
Bar Chart

Band 6+: The graph, below. Shows children's leisure-time activities in California, USA. Write a summary of the information. Select and report the main features, and make comparisons where relevant.

Image for topic: The graph, below. Shows children's leisure-time activities in California, USA. Write a summary of the information. Select and report the main features, and make comparisons where relevant.
Our system will evaluate the answer based on this AI-generated description.
The image shows a horizontal bar chart comparing leisure activities between 1995 and 2010. In 2010, Cooking is around 8, Art is approximately 2, Watching TV or DVDs is about 30, Games (not computer or card) is roughly 8, Cards is close to 6, Computer games is around 18, Reading (Internet materials) is about 8, Reading (books) is around 12, Stamp collecting is roughly 1, Playing a musical instrument is about 6, Sport (not swimming) is around 10, and Swimming is roughly 15. In 1995, Cooking is around 5, Art is approximately 3, Watching TV or DVDs is about 25, Games (not computer or card) is around 18, Cards is close to 5, Computer games is roughly 4, Reading (Internet materials) is about 1, Reading (books) is around 8, Stamp collecting is approximately 7, Playing a musical instrument is about 5, Sport (not swimming) is roughly 10, and Swimming is about 2.
Given the complexity of the image, the above description may not be entirely accurate.
Note: Both the topic and the answer were created by one of our users.

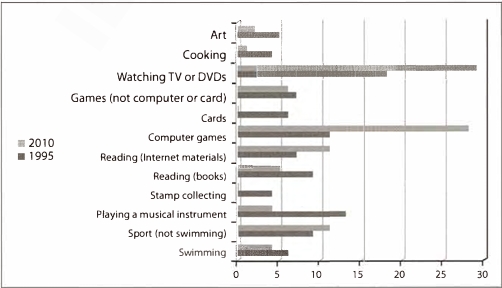
The horizontal bar chart illustrates how freetime activities made by young people in California, USA.

Overall, several changes are represented in the chart, particularly in watching TV or DVDs and computer games. While these two categories received high popularily among children in California, some certain activities, including arts, cooking, and stamp collecting, gained lower attention from young people.

In 1995, watching TV or DVDs was the highest preferenced activities among children in their freetime, at over 15% of them do this . The second highest category was computer games, accounting for over 10%. On the other hands, stamp collecting and cards were two types of activity, which approximately 5% favoured to do in leisure time.

By 2010, although the top hobby remained watching TV or DVDs, at around 28%, children played computer games dramatically increased as the second highest activity, reaching at over 25%. Notably, stamp collecting and cards were two type of activities, distracting attention from children in California.

Word Count: 160

Answers On The Same Topic:

The graph, below. Shows children’s leisure-time activities in California, USA. Write a summary of the information. Select and report the main features, and make comparisons where relevant.

In fifteen-year period from 1995 to 2010, there are huge changes in leisure activites. Most visiables are massive changes in Watching TV or DVDs, which had about 10 percent raise and Computer games, which almost tripled during the time between. Two categories were abounded by California’s children. These are namely: Cards and Stamp collecting, which […]

See All

Other Topics:

The chart below shows the proportion of survey respondents that showed interest in particular sports in three different years in the UK. Summarise the information by selecting and reporting the main features, and make comparisons where relevant.

The bar chart illustrates the percentage of survey participants who were interested in football, swimming, snooker, tennis, and golf between 1995 and 2005. Overall, it can be observed that except for football and tennis, the proportion of people showing interest in all the given sports recorded a fluctuating trend. Additionally, football remained the most popular […]

The bar charts and line graph below show the results of a survey conducted over a three-year period to discover what people who live in London think of the city. Summarize the information by selecting and reporting the main features and make comparisons where relevant.

The bar chart illustrates how the opinions of London residents changed over a three-year period. Overall, the range of shops was the most common response throughout this period, while job opportunities and the diversity of people nearly shared equal proportions, securing second place. Other factors showed slight variations over the three years, but they still […]

The bar charts and line graph below show the results of a survey conducted over a three-year period to discover what people who live in London think of the city. Summarize the information by selecting and reporting the main features and make comparisons where relevant.

The bar chart illustrates data on the share of how the opinion of London residents changed over a three-year period. Overall, the range of shops was most frequent answer throughout the period,while both job opportunities and mixture of people had almost the same proportion and shared second place. The others were slightly changing over the […]

The bar charts and line graph below show the results of a survey conducted over a three-year period to discover what people who live in London think of the city. Summarize the information by selecting and reporting the main features and make comparisons where relevant.

The bar chart illustrates data on the share of how did the opinion of london residents changed over a three-year period. Overall, the range of shops was most often answer throughout the period,while both job opportunities and mixture of people had almost the same proportion and shared the second place. The others were slightly changing […]

The bar charts and line graph below show the results of a survey conducted over a three-year period to discover what people who live in London think of the city. Summarize the information by selecting and reporting the main features and make comparisons where relevant.

The bar chart illustrates the thoughts of London people about life in their city over three years examined. Overall, there was a decrease in the proportion of how people think about the range of shops, job opportunities, the diversity of population, and nightlife, while the opposite trends were seen in the remaining two categories. In […]

The bar chart below shows the five most popular sports

The chart illustrates the percentage of men and women aged 18 to 20 in a city who participated in several activities in one month. Overall, the chart showed five different types of games, like basketball, cycling, football, swimming, and hockey. In four sports, the male percentage is higher than the female percentage, while in swimming, […]

See All
We have detected unusual activity on your device.
Please verify your identity to continue.
Note: This verification step won't sign you in. If you have a premium account, please log in to access the service as usual.
Google/Gmail Verification
Or verify using Email/Code
We've sent a verification code to:
youremail@gmail.com (Not your email?)
Enter it below to complete the verification process.
Ensure your email address is correct, your inbox is not full, and you check your spam folder. If no email arrives, consider using an alternative email.
You will need a Premium plan to perform your action!
Note: If you already have a premium account, please log in to access our services as usual.

Plans & Pricing

Our mission is to make quality education accessible for everyone.
However, to keep our hardworking team running and this service alive, we genuinely need your support!
By opting for a premium plan, not only do you sustain us in achieving the mission, but you also unlock advanced features to enrich your learning experience.

Free

For learners who aren't pressed for time

What's included on Free
100+ Cambridge IELTS Tests
Instant IELTS Writing Task 1 & 2 Evaluation (2 times/month)
Instant IELTS Speaking Part 1, 2, & 3 Evaluation (5 times/month)
Instant IELTS Writing Task 1 & 2 Essay Generator (2 times/month)
500+ Dictation & Shadowing Exercises
100+ Pronunciation Exercises
Flashcards
Other Advanced Tools

Premium

For those serious about advancing their English proficiency, and for IELTS candidates aspiring to boost their band score by 1-2 points (especially in writing & speaking) in just 30 days or less

What's included on Premium
Save Your IELTS Test Progress
Unlock All Courses & IELTS Tests
Unlimited AI Conversations
Unlimited AI Writing Enhancement Exercises
Unlimited IELTS Writing Task 1 & 2 Evaluation
Unlimited IELTS Speaking Part 1, 2, & 3 Evaluation
Checked Answers Will Not Be Published
Unlimited IELTS Writing Task 1 & 2 Essay Generator
Unlimited IELTS Speaking Part 1, 2, & 3 Sample Generator
Unlimited Usage Of Advanced Tools
Priority Support within 24h (12-month plan only)

Due to the nature of our service and the provided free trials, payments are non-refundable.
Nếu bạn là người Việt Nam và không có hoặc không muốn trả bằng credit/debit cards, bạn có thể thanh toán bằng phương thức chuyển khoản:


Chọn gói:
419,000₫ 277,000 ₫ cho gói 1 tháng (chỉ 9,233₫/ngày)
1,239,000₫ 597,000 ₫ cho gói 3 tháng (chỉ 6,633₫/ngày)
2,469,000₫ 1,027,000 ₫ cho gói 6 tháng (chỉ 5,706₫/ngày)
4,929,000₫ 1,417,000 ₫ cho gói 12 tháng (chỉ 3,936₫/ngày)


Sau khi chuyển khoản, vui lòng đợi trình duyệt tự động điều hướng bạn trở lại Engnovate và bạn sẽ ngay lập tức nhận được mã kích hoạt tài khoản premium.
Nếu có lỗi xảy ra, bạn có thể liên hệ với team thông qua một trong các phương thức: email đến helloengnovate@gmail.com hoặc nhắn tin qua facebook.com/engnovate.
Vì toàn bộ công cụ trên website đều có thể sử dụng thử miễn phí, Engnovate không hỗ trợ hoàn tiền.