Our system will evaluate the answer based on this AI-generated description.
The image contains a line graph showing UK residents' spending on visits abroad from 1993 to 2013. The y-axis represents spending in billions (£) from 0 to 30, in increments of 3, and the x-axis illustrates the years from 1993 to 2013 in increments of 5 years. Four types of visits are depicted; Holiday, Business, Visit friends or relatives, and Miscellaneous. Holiday spending starts at approximately 9 billion in 1993, steadily rises to around 18 billion in 2000, slightly decreases and fluctuates until 2006, and then increases to peak at approximately 25 billion in 2008 before dropping to just under 20 billion in 2013. Business spending begins at about 5 billion in 1993, gently increases to 9 billion in 2000, remains stable until 2006, dips to roughly 6 billion in 2009, and recovers to about 8 billion in 2013. Spending to visit friends or relatives starts at around 3 billion in 1993, steadily increases to just over 6 billion in 2006, spikes to about 7.5 billion in 2007, dips slightly and then rises again to approximately 7.5 billion in 2013. Miscellaneous spending commences at around 2 billion in 1993, gradually climbs to about 3 billion in 2006, and remains relatively consistent with minor fluctuations until 2013.
Given the complexity of the image, the above description may not be entirely accurate.
Skyrocket your IELTS band score by 1-2 points in under a month with our premium plan!
Note: Both the topic and the answer were created by one of our users.
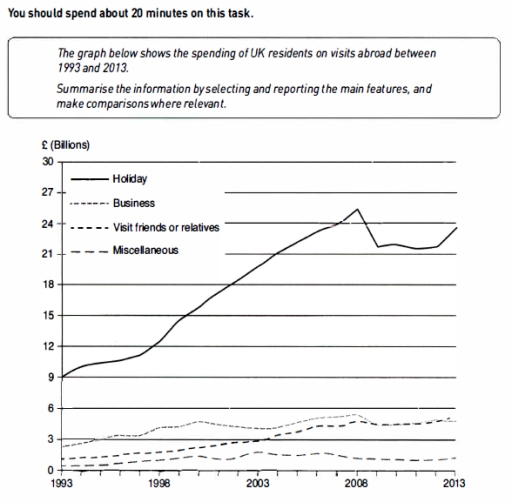
The line graph illustrates the changes in the expenditure of the UK population on four different foreign visits – holiday, business, visit friends or relatives and miscellaneous – over a twenty-year period, commencing from 1993.
Overall, all types of visits followed an upward trend, albeit to varying degrees. The figure for holiday consolidated its leading position throughout the period, whereas the reverse was true for miscellaneous visits. Notably, the spending on business trips and visits to the friends or relatives reached parity between 2008 and 2013.
The money spent on holiday trips rose sharply over the period, while miscellaneous visits remained the lowest category with a gradual growth. The former, which started at approximately 9 billion euros, reached a peak of 25 billion euros by 2008. However, it witnessed a slight downfall afterwards, ending the chart at around 24 billion euros after staging a marginal recovery. The latter, meanwhile, commenced with a chart-low of 1 billion euros, increasing by 0.5 billion euros by the end of the period.
Although less dramatic, the expenditure on business and visiting friends or relatives rose over the period. Having a marginal discrepancy at the outset, at 1.5 billion euros (visiting close ones) and 2.5 billion euros (business), both figures converged at 5 billion euros in 2008. Despite recording identical figures by the end, visiting friends or relatives surpassed its counterpart to a slight degree at 5.1 billion euros by the very end of 2013.
Word Count: 240
