Our system will evaluate the answer based on this AI-generated description.
The image contains a bar chart titled 'PHỔ ĐIỂM MÔN TIẾNG ANH NĂM 2026' showing score distributions and a table with summary statistics. The chart's vertical axis is 'Số lượng thí sinh', and the data points, representing the number of candidates per score range, are as follows: (0, 0.25]: 2; (0.25, 0.5]: 9; (0.5, 0.75]: 50; (0.75, 1]: 255; (1, 1.25]: 432; (1.25, 1.5]: 1083; (1.5, 1.75]: 2212; (1.75, 2]: 4293; (2, 2.25]: 6550; (2.25, 2.5]: 10009; (2.5, 2.75]: 12068; (2.75, 3]: 15847; (3, 3.25]: 17899; (3.25, 3.5]: 18357; (3.5, 3.75]: 19658; (3.75, 4]: 19017; (4, 4.25]: 19574; (4.25, 4.5]: 18836; (4.5, 4.75]: 17957; (4.75, 5]: 17398; (5, 5.25]: 15904; (5.25, 5.5]: 14914; (5.5, 5.75]: 13830; (5.75, 6]: 12404; (6, 6.25]: 11211; (6.25, 6.5]: 9617; (6.5, 6.75]: 8818; (6.75, 7]: 7778; (7, 7.25]: 6884; (7.25, 7.5]: 5274; (7.5, 7.75]: 4894; (7.75, 8]: 3856; (8, 8.25]: 3149; (8.25, 8.5]: 2587; (8.5, 8.75]: 2046; (8.75, 9]: 1284; (9, 9.25]: 770; (9.25, 9.5]: 311; (9.5, 9.75]: 179; (9.75, 10]: 112. The summary table shows: SỐ TS: 334,547; ĐTB: 5.07; TV: 4.75; ĐLC: 1.68; MAD: 1.37; <5: 168,105 (50.249%); >=7: 53,107 (15.874%); Mode: 4.25; Điểm 10: 311; Điểm 0: 0; <=1: 61 (0.018%).
Given the complexity of the image, the above description may not be entirely accurate.
Skyrocket your IELTS band score by 1-2 points in under a month with our premium plan!
Note: Both the topic and the answer were created by one of our users.
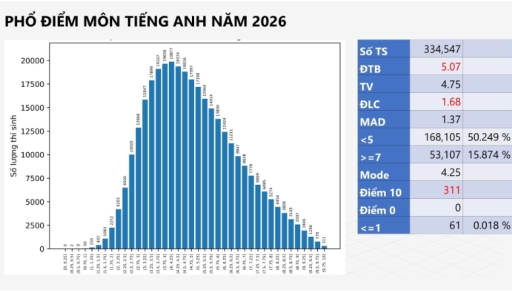
The bar chart illustrates the distribution of scores in the 2026 Vietnamese High School Graduation English examination, while the accompanying table provides information about key statistics related to candidates’ performance.
Overall, it is readily apparent that the results were concentrated in the middle score band, with the highest frequency occurring at about 4.25 points. Additionally, more than half of the candidates score below 5, whereas only a relatively small percentage achieved at least 7.
Looking at score distribution in more detail, the number of candidates rose sharply from the scoring under 1 point group to approximately 20,000 students in the 4.0-4.5 range, where the peak of the distribution was observed. After this, the figures gradually declined as scores increased, falling steadily to only a few hundred candidates in the highest score bands. Perfect scores were extremely rare, with just 311 students receiving a 10, while no candidate scored 0.
Regarding the table, in the total of 334,547 candidates, the average score was 5.07, slightly higher than the median of 4.75, with the standard deviation stood at 1.68. In terms of performance levels, 168,105 candidates (about 50.25%) scored below 5, compared to only 53,107 students (15.87%) who achieved 7 or above. At the lowest point of the scale, only 61 candidates scored 1 or below, accounting for just 0.018% of all test takers.
Word Count: 222