Our system will evaluate the answer based on this AI-generated description.
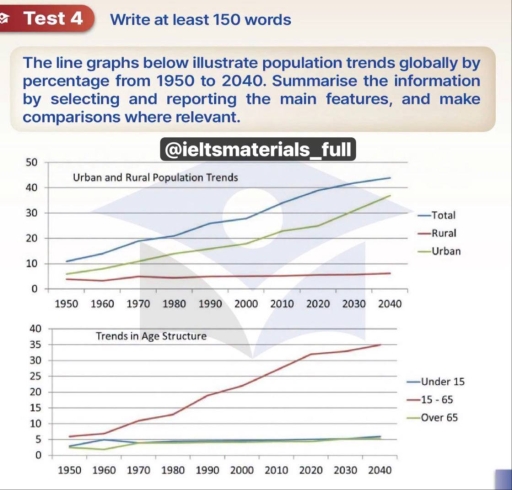
The image contains two line graphs with percentage data from 1950 to 2040. The first graph, 'Urban and Rural Population Trends', shows: Total percentages were 1950(11%), 1960(14%), 1970(19%), 1980(22%), 1990(26%), 2000(28%), 2010(33%), 2020(38%), 2030(42%), 2040(44%); Rural percentages were 1950(4%), 1960(3%), 1970(5%), 1980(4%), 1990(4%), 2000(4%), 2010(4%), 2020(5%), 2030(6%), 2040(7%); Urban percentages were 1950(6%), 1960(9%), 1970(11%), 1980(15%), 1990(18%), 2000(21%), 2010(24%), 2020(29%), 2030(34%), 2040(38%). The second graph, 'Trends in Age Structure', shows: Under 15 percentages were 1950(2%), 1960(5%), 1970(4%), 1980(4%), 1990(4%), 2000(4%), 2010(4%), 2020(4%), 2030(5%), 2040(5%); 15 - 65 percentages were 1950(6%), 1960(8%), 1970(11%), 1980(14%), 1990(20%), 2000(22%), 2010(26%), 2020(31%), 2030(33%), 2040(35%); Over 65 percentages were 1950(2%), 1960(3%), 1970(4%), 1980(4%), 1990(4%), 2000(4%), 2010(4%), 2020(4%), 2030(5%), 2040(6%).
Given the complexity of the image, the above description may not be entirely accurate.
Skyrocket your IELTS band score by 1-2 points in under a month with our premium plan!
Note: Both the topic and the answer were created by one of our users.
The given diagrams illustrate the proportion of global population between 1950 and 2040.
Overall, it is clearly seen that the total proportion of urban and rural population increased steadily throughout the period, while the percentage of rural population fluctuated. Moreover, people aged between 15-65 were dominant all over the period.
Turning to the details, the percentage of rural population started the period with approximately 5%, before fluctuating throughout the period and accounting for 8% in 2040. The ratio of urban population however, stood at 6% in 1950, followed by rapid gradual increase to 20% in 2000, before reaching it’s peak at 38%. Furthermore, the total percentage of population in both areas accounted for 11% in 1950. This ratio then saw a dramatic rise to approximately 42%.
Regarding the trends in age structure, the percentage of people aged between 15-65 saw a tremendous increase from 6% in 1950 to 35% in 2040 respectively, thus making it the dominant sector. In addition, both the proportion of people aged under 15 and over 65 had similar patterns in 1950, with both standing at 5%. Furthermore, both groups fluctuated throughout the period, before accounting for 6% for under 15’s and 5% for over 60’s in 2040 respectively.
Word Count: 203
