IELTS Academic Writing Task 1 can be a challenging test for many students. One of the reasons for this is the variety of question types that may appear on the test, including bar charts, line graphs, pie charts, tables, maps, diagrams, and more. However, understanding the different types of questions and how to approach them can make all the difference in achieving a high score.
In this blog post, we will explore all of the different types of IELTS Academic Writing Task 1 questions that may come up on the test. We will also provide examples and tips on how to approach each type of question, so you can feel confident and prepared on the test day.
Types of IELTS Academic Writing Task 1 Question
Here are all of the different IELTS Academic Writing Task 1 question types you need to know:
1. Describing a Line Graph
Line graphs are used to show trends or changes over time.

- Analysis:
- What is the chart representing?
- What is the unit of measurement?
- Is there a specific time frame or interval shown?
- How many lines are displayed on the chart?
- What is the tense used in the description of the chart?
- Approach:
- Study the x-axis and y-axis labels and the units of measurement.
- Look for trends, fluctuations, and significant points on the graph.
- Structure:
- Introduction: Paraphrase the question.
- Overview:
- Identify the main trend(s) or pattern(s) in the graph.
- Highlight the main trends or patterns.
- Provide a broad description of the data, including any significant changes or fluctuations.
- Body paragraphs: Describe specific features or points on the graph
- Describe the trend and the significant changes.
- Break down the data by showing specific data points and trends.
- Compare and contrast the data if applicable.
- Use linking words and phrases to connect the data points and trends.
- Vocabulary:
- Use a variety of verbs to describe trends, such as “rise,” “increase,” “grow,” “fall,” “decrease,” “drop,” and “level off.”
- Use adjectives to describe the degree of change, such as “dramatic,” “significant,” “moderate,” or “slight.”
- Use linking words and phrases to connect ideas and show relationships, such as “while,” “although,” “despite,” and “due to.”
- Tense:
- Use the simple present tense to describe general truths or ongoing trends, such as “the data shows,” “the graph indicates,” or “the trend is.”
- Use the past tense to describe specific data points or changes, such as “in 2015, the figure was,” “there was a sharp increase in,” or “the numbers fell dramatically.”
- Sample line graph and model answer:

It is important to identify the key features of the graph, such as:
- The highest and lowest points
- The overall trend
- Any significant changes
2. Describing a Bar Graph
Bar graphs are used to compare data between different items or groups.

- Analysis:
- What is the main subject of the bar chart?
- What are the units of measurement used?
- Are the bars arranged in any particular order?
- How many categories or groups are being compared?
- What is the overall trend displayed in the chart?
- Approach:
- Identify the different categories on the x-axis and the values on the y-axis.
- Look for comparisons and contrasts between the bars.
- Structure:
- Introduction: Paraphrase the question.
- Overview:
- Identify the main differences or similarities between the categories.
- Compare the highest and lowest bars and any significant differences.
- Provide a brief description of the data, including any significant differences.
- Body paragraphs: Describe specific data points and comparisons between bars
- Describe the comparison between the items or groups.
- Break down the data by showing specific data points and comparisons between the categories.
- Highlight the significant differences.
- Use linking words and phrases to connect the data points and comparisons.
- Vocabulary:
- Use appropriate adjectives to describe the size or quantity of each category, such as “large,” “small,” “significant,” or “minor.”
- Use linking words and phrases to compare and contrast categories, such as “in contrast,” “on the other hand,” and “similarly.”
- Tense:
- Use the simple present tense to describe general truths or ongoing comparisons, such as “the chart shows,” “the data indicates,” or “the difference is.”
- Use the past tense to describe specific data points or comparisons, such as “in 2015, the figure for A was,” “B had a higher percentage than,” or “there was a significant contrast between.”
- Sample bar graph and model answer:

It is important to identify the key features of the graph, such as:
- The highest and lowest bars
- The most and least popular items
- Any significant differences
3. Describing a Pie Chart
Pie charts are used to show data percentages of a whole.

- Analysis:
- What does the pie chart represent?
- What are the percentages or proportions shown?
- Are there any significant differences between the sections of the chart?
- What is the largest or smallest section of the chart?
- What conclusions can be drawn from the chart?
- Approach:
- Identify the different categories and their corresponding percentages.
- Look for the largest and smallest slices and any notable differences.
- Structure:
- Introduction: Paraphrase the question.
- Overview:
- Identify the largest and smallest slices and any significant differences.
- Compare the largest and smallest slices and any significant differences.
- Provide a brief description of the data.
- Body paragraphs: Describe specific data points and comparisons between slices
- Break down the data by showing specific data points and comparisons between the categories.
- Describe the proportions of the groups
- Highlight the most and least represented groups
- Use linking words and phrases to connect the data points and comparisons.
- Vocabulary:
- Use percentages and fractions to describe each category.
- Use adjectives to describe the degree of difference between categories, such as “marked,” “slight,” or “significant.”
- Use linking words and phrases to show relationships between categories, such as “corresponding to,” “accounting for,” and “contributing to.”
- Tense:
- Use the simple present tense to describe general truths or ongoing proportions, such as “the pie chart illustrates,” “the data suggests,” or “the largest slice is.”
- Use the past tense to describe specific data points or proportions, such as “in 2015, the percentage for C was,” “D accounted for a smaller proportion than,” or “there was a slight shift in the distribution from.”
- Model answer:

It is important to identify the key features of the chart, such as:
- The largest and smallest segments
- The most and least represented groups
- Any significant differences
4. Describing a Table
Tables are used to present data measurements in a structured format.

- Analysis:
- What is the main topic or subject of the table?
- What are the categories or variables being compared?
- How are the values arranged within the table?
- Are there any significant differences or patterns in the data?
- What are the highest or lowest values in the table?
- Approach:
- Study the headings and units of measurement for each column and row.
- Look for patterns, rankings, and comparisons.
- Structure:
- Introduction: Paraphrase the question.
- Overview:
- Identify the highest and lowest values and any significant differences.
- Provide a brief description of the data.
- Details: Describe specific data points and comparisons between rows and columns
- Break down the data by showing specific data points and comparisons between the rows and columns.
- Highlight the most and least profitable professions.
- Use linking words and phrases to connect the data points and comparisons.
- Vocabulary:
- Use appropriate adjectives to describe the size or quantity of each row or column, such as “lowest,” “highest,” “most,” or “least.”
- Use linking words and phrases to compare and contrast rows or columns, such as “in contrast,” “on the other hand,” and “similarly.”
- Tense:
- Use the simple present tense to describe general truths or ongoing rankings or comparisons, such as “the table presents,” “the data compares,” or “the figures show.”
- Use the past tense to describe specific data points or rankings, such as “in 2015, the number for X was,” “Y had the highest total of,” or “there was a significant difference between Z and.”
- Sample line graph and model answer:

It is important to identify the key features of the table, such as:
- The highest and lowest values
- The most and least profitable professions
- Any significant differences
5. Describing a Map
Maps are used to show a location or a facility such as a street map and a plan of a building or site.

- Analysis:
- What does the map show?
- What is the scale of the map?
- Are there any significant features or landmarks highlighted on the map?
- What is the overall trend or pattern shown in the map?
- What conclusions can be drawn from the map?
- Approach:
- Identify the key features of the map, such as roads, buildings, landmarks, and areas of open space.
- Look for patterns, such as the layout of streets or the distribution of buildings.
- Identify any changes or developments over time.
- Structure:
- Introduction: Paraphrase the question.
- Overview:
- Identify the key features of the map, such as roads, buildings, landmarks, and areas of open space.
- Summarize the main stages and the overall process.
- Provide a brief description of the data.
- Body paragraphs:
- The location of the shops or facilities.
- Highlight the distance between them.
- Describe the key features of the map in a logical and organized way.
- Use linking words and phrases to connect the different features.
- Vocabulary:
- Use prepositions to describe the location of features, such as “to the north of,” “adjacent to,” or “surrounded by.”
- Use adjectives to describe the size, shape, or function of features, such as “large,” “narrow,” or “commercial.”
- Tense:
- Use the simple present tense to describe general truths or ongoing features or locations, such as “the map displays,” “the data identifies,” or “the area is.”
- Use the past tense to describe specific data points or locations, such as “in 2015, the building was,” “there used to be a park where,” or “the river flowed through.”
- Sample line graph and model answer:

It is important to identify the key features of the map, such as:
- The location of different shops or facilities
- The distance between them
- Any significant differences
6. Describing a Process/Diagram
Process diagrams are used to show the stages or steps in a process and their order.

- Analysis:
- What is the process being shown in the diagram?
- What are the main stages or steps in the process?
- Are there any key inputs or outputs shown in the diagram?
- Are there any significant changes or transformations in the process?
- What is the final outcome or result of the process?
- Approach:
- Identify the different stages or steps in the process and their order.
- Look for the inputs, outputs, and transformations that occur.
- Look for any significant changes or developments.
- Structure:
- Introduction: Paraphrase the question.
- Overview:
- Identify the main stages of the process and the inputs, outputs, and transformations that occur.
- Provide a brief description of the data.
- Summarize the main stages and the overall process.
- Body paragraphs: Describe each stage in detail and the key features of each
- Describe the main steps and the significant changes of the process in detail and the key features of each.
- Compare and contrast the data if applicable.
- Use linking words and phrases to connect the different stages.
- Vocabulary:
- Use appropriate verbs to describe each stage of the process, such as “input,” “transform,” or “output.”
- Use linking words and phrases to show the sequence of stages, such as “after,” “before,” “subsequently,” and “finally.”
- Tense:
- Use the simple present tense to describe general truths or ongoing stages or transformations, such as “the diagram represents,” “the data outlines,” or “the process involves.”
- Use the past tense to describe specific data points or stages, such as “in the first step, the input was,” “there was a change in the output from,” or “the transformation led to.”
- Sample line graph and model answer:
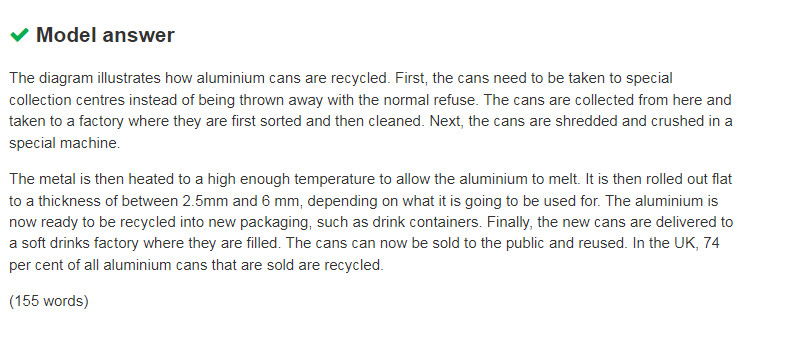
It is important to identify the key features of the diagram, such as:
- The starting and ending points
- The main steps
- Any significant changes
7. Describing Combination
A combination task may include two or more types of graphs or diagrams, and it requires candidates to compare and contrast the information presented.

- Analysis:
- What types of charts or diagrams are included in the combination?
- What is the main topic or subject of the combination?
- How are the various elements of the combination related to each other?
- What is the overall trend or pattern shown in the combination?
- What conclusions can be drawn from the combination?
- Approach:
- Study the different elements of the visual representation and how they relate to each other.
- Look for patterns, trends, and comparisons between different types of data.
- Structure:
- Introduction: Paraphrase the question.
- Overview:
- Identify the different elements of the visual representation and how they relate to each other.
- Provide a brief description of the data.
- Body paragraphs: Describe specific data points and comparisons between different elements
- Describe each element in detail and the key features of the different types of graphs or diagrams
- Compare and contrast the data presented.
- Use linking words and phrases to connect the different elements and show their relationships.
- Vocabulary:
- Use appropriate language for each type of visual representation and show how they are related to each other.
- Use linking words and phrases to connect ideas and show relationships, such as “whereas,” “in comparison,” “in addition,” and “moreover.”
- Tense:
- Use appropriate tenses for each type of visual representation and make sure they are consistent throughout the analysis.
- Use linking words and phrases to connect ideas and show relationships between different tenses, such as “while,” “although,” “despite,” and “due to.”
- Sample line graph and model answer:

Conclusion
In conclusion, the IELTS Academic Writing Task 1 test can be challenging, but understanding the different types of questions and how to approach them is crucial to achieving a high score. By familiarizing yourself with line graphs, bar charts, pie charts, tables, maps, and combinations thereof, you can feel confident and prepared on test day.
Remember to focus on the key trends, comparisons, components, data points, and features, and use specific data to support your analysis. With these tips and examples in mind, you can be well on your way to achieving your desired score.


very helpful resources