Part 1
You should spend about 20 minutes on this task. Write at least 150 words.
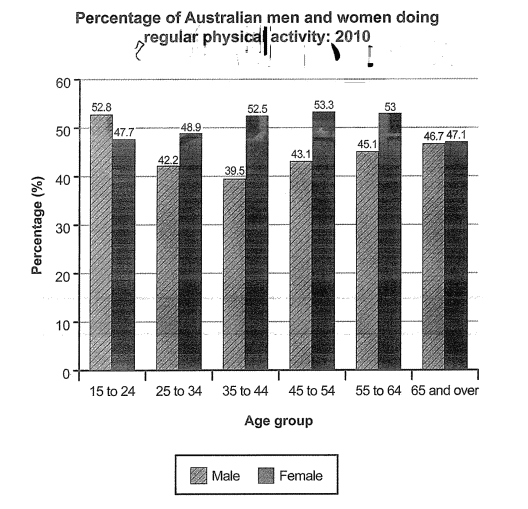
The bar chart below shows the percentage of Australian men and women in different age groups who did regular physical activity in 2010.
Summarise the information by selecting and reporting the main features, and make comparisons where relevant.
Samples
Words: 0
This website was truly helpful for everyone IELTS student
This website was very helpful
BAND 8.5
The bar chart below illustrates the rate of Australian males and females across six different age groups who engaged in regular physical activity in the year 2010.
Overall, at the start of the period, the percentage of men was higher, whereas the opposite was true at the end of the period.
Regarding the percentages for men, it accounted for 52.8% in the ’15-to-24-years-old’ classification. It then decreased moderately to 39.5% in the ’35-to-44-years-old’ classification. Moving on to the last age group, it increased gradually and was relatively stable, ending at 46.7%, making the percentage for men slightly lower than the percentage for women.
As for women, the percentage began at 47.7%. Afterwards, it rose steadily to 52.5% in the ’35-to-44-years-old’ category. Interestingly, this was the age group with the biggest percentage gap between both genders. From that category to the ’55-to-64-years-old’ category, the rate almost stayed constant before falling to 47.1% in the final category.
bro it is nor about changing.
Band score:8
Band Score : 9
The bar graph illustrates the percentage of Australian men and women in various age groups who engaged in regular physical activity in 2010.
Overall, women were generally more physically active than men in most age categories, except in the youngest group (15 to 24), where the male participation rate was higher. The participation gap between genders varied across age groups but tended to favor females in the middle-aged and older brackets.
In the 15 to 24 age group, 52.8% of men exercised regularly compared to 47.7% of women. However, this trend reversed in the 25 to 34 group, where female participation rose slightly to 48.9%, while male activity dropped significantly to 42.2%. This gap widened further in the 35 to 44 and 45 to 54 groups, with women outpacing men by over 9 percentage points in each.
Among those aged 55 to 64, women still led slightly with 53% compared to 45.1% of men. The oldest group (65 and over) showed nearly equal rates of activity, with 46.7% of men and 47.1% of women participating.
In summary, although young men were more active than women, women overtook men in all older age groups, showing a stronger trend of regular physical activity among females as age increased.
The chart illustrates the proportion of Australian men and women who represent different age groups doing physical activity in the year 2010.
Overall, it is evident that the groups of young men who are in the age group 15-24 exercised the most among men in 2010, while the older women groups, such as those who are between 45 and 54, did the most exercise overall in that year. Furthermore, women groups who are older than 25 participated in regular physical activity more than men groups who are older than 25.
Looking at the chart in more detail, it is seen that men in their middle ages participated in far less physical exercise than women in their middle ages. For example, in the age groups 25 to 34 and 35 to 44, men accounted for 42.2% and 39.5%, respectively, while women accounted for 48.9% and 52.5%, respectively.
Turning to the other data sets, it is clear that men in their youth exercised more than women in that age bracket, for example, women accounted for 47.7% in physical activity while men accounted for 52.8% in 2010, considering the 15 to 24 age bracket. In contrast, women in their late forties participated in more physical exercise compared to men, with men only having 43.1% and 53% in the age categories 45 to 54 and 55 to 64, while women accounted for 53.3% and 53%, respectively. The difference is less (only 1%) in the case of the 65 and older age group.
this is around band 7.5
Could you check mine as well please
The bar chart below highlights information about the percentage of Australian male and female participating in physical activities in different age groups in 2010.
Overall, it is clear that women were generally more physically active than male in most age categories, except in the youngest group (from 15 to 24). Interestingly, men who did regular physical activity generally decline from the youngest group (15 to 24), while women attend more to physical exercises rose in the middle-aged and older brackets.
If we look at the details, in the 15 to 24 age group, men doing regular physical activity dominated women at 52,8% and 47,7% respectively. However, this trend reversed in the 25 to 34 age group, where female participate a slightly rose to 48,9%, while men attending to regular physical exercises dropped to 42,2%. Similarly, in the middle age group (35 to 44), men who did regular train declined to 39,5%, where female doing regular train rose significantly to 52,5%.
According in the 45 to 54 age group, both of the genders rose, while female who did physical activity rose slightly for 0,8%, men increased for 3,8%. However, this trend again reversed in the 55 to 64 age group, while female declined slightly to 53%, men increased to 45,1% . The oldest group present approximately familiar results with 46,7% male participants and 47,1 female who did regular exercises.
Band Score: 6.5
The information about the proportion of Australian men and women in different age groups who did regular physical activity in 2010 is depicted by the rendered bar chart. The data have been measured in percentages.
Overall, it can be vividly seen that although all the age groups show upsurge trend, the age group from 45 to 54 tops in the list throughout the span. However, females was less active compared to males.
Looking at the details, in the 15-24 age groups, males had the highest participation rate at 52.8%, compared to 47.70% for females. Meanwhile, the age gap between 25 to 34, a higher percentage of males choose doing physical activity rather than females. On the other hand, there was a significant increase in the ratio of age group between 35 and 44, it comprised for 39.5% for females and the males was 52.5%, respectively.
Moving further, a slight decrease was observed in the trend of males physical activity stood at 53.3%, then the figure for females age gap from 45 to 54 dropped to 43.1% in 2010. Whereas, the rate of men activities wend down to 53% in the age group 55 to 64, then the figure for females, it accounted for 45.1%, respectively. While, a 47.1% of incline was comprised in males in the group of 65 and over. The increment of 46.7% was seen in the females in the age of 65, respectively. Compared with the amount of females, the number of males were considerably higher.
The chart elucidates Australian population who were indulge in regular physical activities in 2010. The image offers the comparison between men and women, ranging from age 15 to above 65.
The graph shows that female ageing from 25 to 64 were actively participating in different sports. Surprsingly, a significant difference is observed in male to female ratio regarding fitness. Generally, sports and exercise are considered as men’s domain, but statistics collected from Australia proves that this narrative is false.
However, ladies below from 15 to 24, are less inclined towards action and games than the young boys. Numerous facts, such as, studies, domestic responsibilities, and jobs could be the reason. Additionally, old people above 65 years, are continuously practicing the outdoor schedules regardless to their gender.
Overall, the trend of day-to-day workout in Australian people is quite refreshing. It helps them to stay active and productive, even in their older days.
The bar chart illustrates the proportions of males and females in various age groups who did regular physical activities in the year 2010. The data are presented in percentages for six age groups: 14-24, 25-34, 35-44, 45-54, 55-64, and 65+.
Overall, women were more active than men except the youngest age group of 15 to 24.
In the 15-24 age groups, males had the highest participation rate at 52.8%, compared to 47.70% for females. However, in the age group, men’s activity had decreased to 42.20%, while it had increased for women. In the next age group (35-44), downward trend observed for men, reaching its nadir at 39.5%, in contrast women were active with a positive trend at 52.50%, then reaching its peak at 53.30% in the following age group i.e. 45-54. Although males were becoming active in this group (45-54), there was a gap of around 10%. The gap was largest in the preceding age groups of 35-44, which is about 13% between the participation of males and females.
In the second-to-last age group (55-64) and last one (65+), men’s physical activity had improved and the gap was minimal between males and females at age 65 and above.