Our system will evaluate the answer based on this AI-generated description.
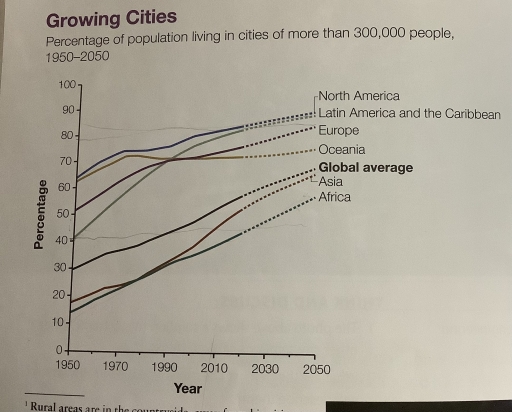
The image shows a line graph representing the percentage of the population living in cities with more than 300,000 people from 1950 to 2050. In 1950, North America is at approximately 60%, Latin America and the Caribbean at 30%, Europe at 40%, Oceania at 40%, global average at 25%, Asia at 15%, and Africa at 10%. By 1970, North America reaches 70%, Latin America and the Caribbean 40%, Europe 50%, Oceania remains close to 40%, global average increases to 30%, Asia 20%, and Africa 15%. In 1990, North America rises to 75%, Latin America and the Caribbean 55%, Europe 60%, Oceania 50%, global average near 40%, Asia 30%, and Africa 25%. By 2010, North America achieves 80%, Latin America and the Caribbean 70%, Europe approaches 70%, Oceania approximately 60%, global average near 50%, Asia 45%, and Africa 35%. Projected to 2030, North America remains at 85%, Latin America and the Caribbean at 75%, Europe slightly above 70%, Oceania 65%, global average surpassing 50%, Asia nearing 50%, and Africa 45%. By 2050, North America stabilizes at 90%, Latin America and the Caribbean at 80%, Europe holds at 80%, Oceania approaching 70%, global average near 60%, Asia surpassing 55%, and Africa nearing 55%.
Given the complexity of the image, the above description may not be entirely accurate.
Skyrocket your IELTS band score by 1-2 points in under a month with our premium plan!
Note: Both the topic and the answer were created by one of our users.
The given line graph illustrates the population growth of cities with populations exceeding 300,000 people from 1950 to 2050. Overall, there is a noticeable increase over the years, with North America showing the highest numbers and Africa the lowest.
To begin with, in 1950, Asia and Africa had a similar starting point at around 15%. However, by 2050, Asia reached the global average, with a percentage of 60%. Additionally, Europe experienced rapid growth, rising from 50% to 80%, securing the third position among the regions presented.
In contrast, Latin America and the Caribbean excelled beyond Europe, increasing from 40% to 80%, coming very close to North America’s figures. Likewise, each region is projected to continue a steady population growth, averaging an increase of 40% by the end of 2050.
In summary, cities are continuing to improve their population numbers. Migration and urbanization significantly contribute to this upward trend in population data.
Word Count: 151
