Our system will evaluate the answer based on this AI-generated description.
The image contains a bar chart comparing the percentage of men, women, and children who ate five portions of fruit and vegetables per day in the UK from 2001 to 2008. In 2001, the percentages were approximately 22% for men, 25% for women, and 11% for children. In 2002, the figures were roughly 23% for men, 27% for women, and 10% for children. The 2003 data shows about 22% for men, 28% for women, and 11% for children. In 2004, the percentages were approximately 24% for men, 29% for women, and 12% for children. In 2005, about 25% of men, 30% of women, and 14% of children consumed the recommended portions. The 2006 data shows roughly 27% for men, 30% for women, and 16% for children. In 2007, the percentages were approximately 26% for men, 32% for women, and 18% for children. Lastly, in 2008, about 25% of men, 31% of women, and 20% of children met the five-a-day guideline.
Given the complexity of the image, the above description may not be entirely accurate.
Skyrocket your IELTS band score by 1-2 points in under a month with our premium plan!
Note: Both the topic and the answer were created by one of our users.
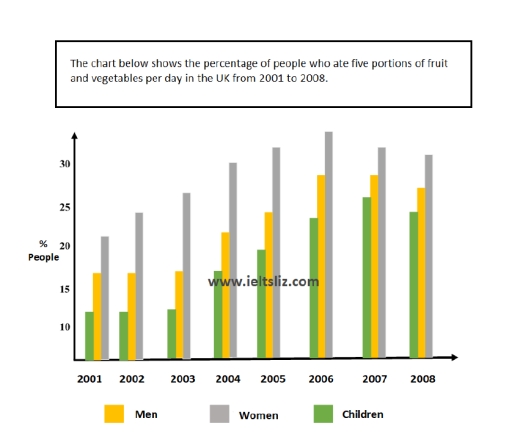
The bar chart compares proportions of people eating fruit and vegetables (five portions daily) in the United Kingdom over a period of time from 2001 to 2008 (values are shown in percentages).
Overall, Y-axis shows percentages of people divided every five units from 0 to over 30, while X-axis illustrates every year since 2001 to 2008. It is clearly seen that women were the highest group in eating that food each year, followed by men in second, and children in the least place. Additionally, it was observed an increasing intake trend in all people during the majority of time, with the exception of the last year when all of them decreased.
Initially, in 2001 and 2002, females started with values between 20% and 25%. Next, they reached the highest point in 2006 (over 30) and then, it decreased.
Word Count: 138
