Our system will evaluate the answer based on this AI-generated description.
The image contains a line graph showing UK residents' spending on visits abroad from 1993 to 2013. The y-axis represents spending in billions (£) from 0 to 30, in increments of 3, and the x-axis illustrates the years from 1993 to 2013 in increments of 5 years. Four types of visits are depicted; Holiday, Business, Visit friends or relatives, and Miscellaneous. Holiday spending starts at approximately 9 billion in 1993, steadily rises to around 18 billion in 2000, slightly decreases and fluctuates until 2006, and then increases to peak at approximately 25 billion in 2008 before dropping to just under 20 billion in 2013. Business spending begins at about 5 billion in 1993, gently increases to 9 billion in 2000, remains stable until 2006, dips to roughly 6 billion in 2009, and recovers to about 8 billion in 2013. Spending to visit friends or relatives starts at around 3 billion in 1993, steadily increases to just over 6 billion in 2006, spikes to about 7.5 billion in 2007, dips slightly and then rises again to approximately 7.5 billion in 2013. Miscellaneous spending commences at around 2 billion in 1993, gradually climbs to about 3 billion in 2006, and remains relatively consistent with minor fluctuations until 2013.
Given the complexity of the image, the above description may not be entirely accurate.
Skyrocket your IELTS band score by 1-2 points in under a month with our premium plan!
Note: Both the topic and the answer were created by one of our users.
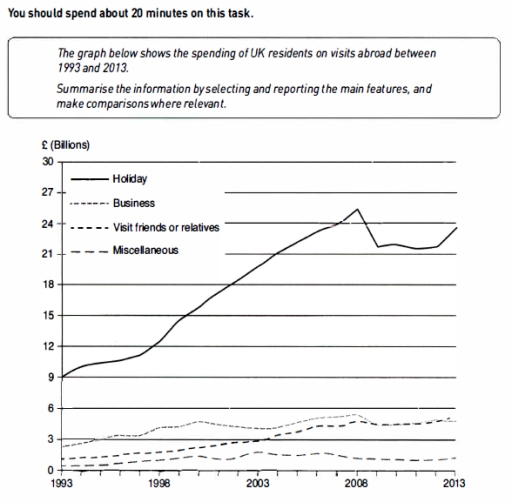
The line graph illustrates the spending of money of the UK citizens on traveling overseas in Billions of Poundsterling ranging from 1993 to 2013.
Overall, it is clear that holidays were the most popular activities with huge amounts of expenditure during the period while others were relatively stable with slight changes; however, the number of people visiting friends gradually increased to second place at the end of the period.
To begin with, holiday expenditure was predominant, leading with 9 billion and peaked in 2008 at approximately 25 billion. In spite of the fact that there was a sharp fall in 2019, the trend kept rising to the end of the period to just below 24 billion.
It can also be seen that, money spended on business travel which was the second biggest spending in the beginning of the period, ended up as the third at around 5 billion in 2013 which is nearly the same number as visiting friends or relatives. However, the spending of money on miscellaneous activities fluctuated and only increased slightly by around 2 billion pounds.
Word Count: 179
