🔥 Today Only: Save 30% on Premium — Offer Ends Soon! - Upgrade Now!
Bar Chart

Band 4+: The bar chart below shows the different types of electronic devices used by people in Australia. Summarise the information by selecting and reporting the main features, and make comparisons where relevant.

Image for topic: The bar chart below shows the different types of electronic devices used by people in Australia. Summarise the information by selecting and reporting the main features, and make comparisons where relevant.
Our system will evaluate the answer based on this AI-generated description.
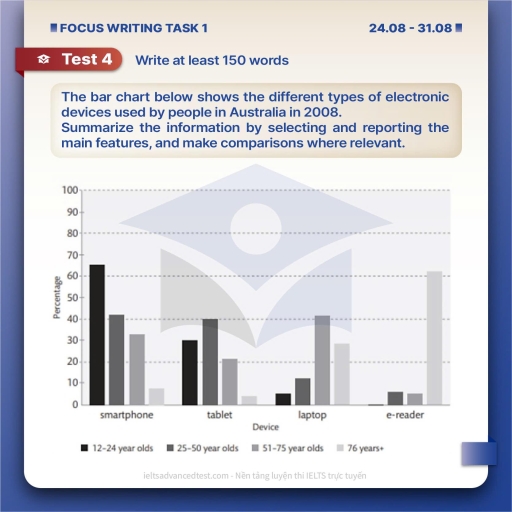
The image features a bar chart measuring "Percentage" along the vertical y-axis (from 0 to 100 with gridlines at intervals of 20) across four categories on the horizontal x-axis labeled "Device": smartphone, tablet, laptop, and e-reader, segmented into four age groups: 12-24 year olds, 25-50 year olds, 51-75 year olds, and 76 years+. For smartphones, the percentages are approximately 65% for 12-24 year olds, 42% for 25-50 year olds, 33% for 51-75 year olds, and 7% for 76 years+. For tablets, values are 30% for 12-24 year olds, 40% for 25-50 year olds, 21% for 51-75 year olds, and 4% for 76 years+. For laptops, the proportions are approximately 5% for 12-24 year olds, 12% for 25-50 year olds, 41% for 51-75 year olds, and 28% for 76 years+. For e-readers, values are approximately 1% for 12-24 year olds, 6% for 25-50 year olds, 5% for 51-75 year olds, and 62% for 76 years+.
Given the complexity of the image, the above description may not be entirely accurate.
Note: Both the topic and the answer were created by one of our users.

The bar chart illustrates the varities of electronic devices used by humans in Australia 2008.

Overall, it is clear that smartphones and tablets are more common among 12-24 year olds, it is about 30% to 65%.it shows that thare is a huge demand for this kind of devices among younger generation.

However, when it comes to the elderly people around 51-75year old and 76 years+, they did not have a good communication with tablet and smartphones and the percentages are 0%-5% and it simply clears that they prefer other kind of devices rather than smartphones.

By contrast, elderly peope the millenials and x generation have a different preffence about electronics. The statistics shows that thay prefer more comfortable stuffs like laptops and e-reader for open a important fyles and reading electonical articles, books, and of course it may also for their jobs. 51-76 years old people usege were 41% to 61% for laptops and e-readers.

Word Count: 155

Answers On The Same Topic:

The bar chart below shows the different types of electronic devices used by people in Australia. Summarise the information by selecting and reporting the main features, and make comparisons where relevant.

The provided bar chart illustrates the proportions of people in four age groups from 12 to 24, 25 to 50, 51 to 75, and more than 76 using four distinct devices including smartphone, tablet, laptop, and e-reader in Australia in 2008. Overall, it is clear to see that the percentage of people aged 12-50 mainly […]

See All

Other Topics:

The chart below shows the number of Asian elephants between 1997 and 2004.

The provided bar graph compares the number of Asian elephants across different countries, including Vietnam, India, Malaysia, Sri Landa, Cambodia, Laos, Myanmar, Thailand and China between 1997 and 2004. Overall, it is clear that most countries witnessed a decline in the number of elephants, with an exception of Cambodia. Additionally, India recorded the highest figure […]

The bar chart shows the proportion of male and female aged 60-64 who were work in Belgium, USA, Japan, Indonesia in 1970 and 2020

The bar charts give information about how males and females employed among individuals aged 60-64 in four nations in the years of 1970 and in 2020. Overall, despite varying conditions, men employed in USA, Japan and Indonesia experienced an upward trend, compared to women which increased only in Japan and Indonesia, whereas the reverse was […]

The bar chart shows the percentages of the Canadian workforce in five major industries in 185 and 2020. Summarise the information by selecting and reporting the main features, and make comparisons where relevant.

The bar chart below displays the percentage points of the Canadian workforce and divide it into five categories based on the type of industry the people work for the years 1850 and 2020. Overall, the distribution of forces in the earlier period was relatively equal. The predominant sphere in which people were employed was manufactory, […]

This chart shows the percentage of fuel from renewable energy used in the transport sector in six European Union countries in 2009 and 2010, compared to the average. Percentage of fuel from renewable energy used in the transport sector in 2009 and 2010

The bar chart compares the percentage of fuel from renewable energy used in transportation across six European nations and the EU average in 2009 and 2010. Overall, the fuel usage trends varied considerably across the countries, while the average recorded a general growth. Slovakia recorded the highest figure throughout the period, despite a decline, whereas […]

The following chart illustrates the results of a British survey taken in 2005 related to Housing preferences of UK people.

the given chart illustrated the percentage of people living in Liverpool, London and Manchester who prefered four type of housing in UK during 2009. overall, the number of people who chose apartments in Liverpool reached the highest point, London had the highest preference in semi-detached house, whereas Manchester prefered both detach and semi-detached one. however, […]

The bar chart below represents the plastic waste generation in different regions (in million tons) from 1995 to 2020. Summarise the information by selecting and reporting the main features and make comparisons where relevant.

The bar chart illustrates the information regarding generation of plastic waste in million tons from 19995 to 2020 in four different regions (North America,Europe,Asia,South America). Overall,in first year south america was the least and north america highest.In some years north america and europe on the same number.The data measured in percentage. In 1995,North america was […]

See All
We have detected unusual activity on your device.
Please verify your identity to continue.
Note: This verification step won't sign you in. If you have a premium account, please log in to access the service as usual.
Google/Gmail Verification
Or verify using Email/Code
We've sent a verification code to:
youremail@gmail.com (Not your email?)
Enter it below to complete the verification process.
Ensure your email address is correct, your inbox is not full, and you check your spam folder. If no email arrives, consider using an alternative email.
You will need a Premium plan to perform your action!
Note: If you already have a premium account, please log in to access our services as usual.

Plans & Pricing

Our mission is to make quality education accessible for everyone.
However, to keep our hardworking team running and this service alive, we genuinely need your support!
By opting for a premium plan, not only do you sustain us in achieving the mission, but you also unlock advanced features to enrich your learning experience.

Free

For learners who aren't pressed for time

What's included on Free
100+ Cambridge IELTS Tests
Instant IELTS Writing Task 1 & 2 Evaluation (2 times/month)
Instant IELTS Speaking Part 1, 2, & 3 Evaluation (2 times/month)
Instant IELTS Writing Task 1 & 2 Essay Generator (2 times/month)
500+ Dictation & Shadowing Exercises
100+ Pronunciation Exercises
Flashcards
Other Advanced Tools

Premium

For those serious about advancing their English proficiency, and for IELTS candidates aspiring to boost their band score by 1-2 points (especially in writing & speaking) in just 30 days or less

What's included on Premium
Save Your IELTS Test Progress & Analyze Mistakes By Question Type
Save Your Own Flashcard Sets & Use Them On Any Device
Unlock All Courses, IELTS Tests, Section & Part Practice
Unlimited AI Conversations
Unlimited AI Writing Enhancement Exercises
Unlimited IELTS Writing Task 1 & 2 Evaluation
Unlimited IELTS Speaking Part 1, 2, & 3 Evaluation
Checked Answers Will Not Be Published
Unlimited IELTS Writing Task 1 & 2 Essay Generator
Unlimited IELTS Speaking Part 1, 2, & 3 Sample Generator
Unlimited Usage Of Advanced Tools & AI Features
Priority Support within 24h (12-month plan only)

Due to the nature of our service and the provided free trials, payments are non-refundable.