🔥 Today Only: Save 30% on Premium — Offer Ends Soon! - Upgrade Now!
Bar Chart

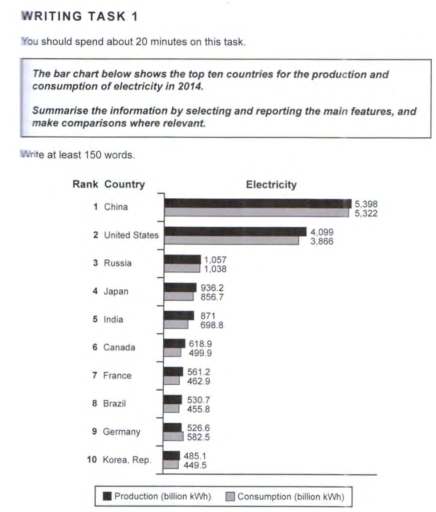
Band 4+: The bar chart below shows top ten countries for the production and consumption of electricity in 2014.

Image for topic: The bar chart below shows top ten countries for the production and consumption of electricity in 2014.
Our system will evaluate the answer based on this AI-generated description.
The image presents a bar chart with the top ten countries for production and consumption of electricity in 2014, ranking from 1 to 10. The chart has two different types of bars representing production (billion kWh) and consumption (billion kWh) for each country. For China, production is at 5,398 and consumption is at 5,322. For the United States, production is at 4,089 and consumption is at 3,866. Russia's production is at 1,057 and consumption is at 1,038. Japan has a production of 936.2 and a consumption of 856.7. India's production is at 871 and consumption is at 818.8. Canada has a production of 618.9 and consumption of 499.9. France's production is at 562.2 and consumption is at 461.9. Brazil has a production of 530.7 and consumption of 455.8. Germany's production is at 526.6 and consumption is at 582.5. Lastly, the Republic of Korea has a production of 485.1 and consumption of 449.5.
Given the complexity of the image, the above description may not be entirely accurate.
Note: Both the topic and the answer were created by one of our users.

The supplied bar chart gives data on what alterations covered with the most popular 10 nations for the manufacture and electricity consumption in 2014.

Overall, the most striking feature of the chart is that China witnessed the most dramatic changes of rising than the other countries during the surveyed period. Moreover, France, Brazil, Germany and Korea Rep were roughly constantly the the same in this year.

In more details, China reached to 5,392 billion kWh of production and 5, 322 billion kWh of consumtion, while the United States became only 6,099 billion kWh and 3,866 billion kWh respectively. Next group of countries: Russia, Japan and India had an approximately the same results, between 1,057-871 billion kWh of production and between 1,038-6,988 billion kWh of consumption. It was a gentle falling from Russia to India in 2014.

Furthermore, France, Brazil and Korea Rep illustrated a stable level, from 561,2 – 485 billion kWh of manufacture and from 462,9- 449,5 kWh of consumption. Germany showed a little more then this group, 526,6 billion kWh of production and 582,5 billion kwh of consumption in 2014.

Word Count: 182

Answers On The Same Topic:

The bar chart below shows top ten countries for the production and consumption of electricity in 2014.

The provided bar chart compares the top ten countries in terms of electricity production and consumption in 2014, and the data is presented in billions. From an overall perspective, it is apparent that China and USA dominated both the generation and usage of electricity, while the Republic of Korea recorded the lowest figures. Significantly, the […]

The bar chart below shows top ten countries for the production and consumption of electricity in 2014.

The bar chart illustrates electricity production and consumption levels (in billion kWh) among the ten leading countries in 2014. Overall, China and the United States were by far the most significant producers and consumers of electricity, with China slightly leading in both aspects. In contrast, Korea, Rep. had the lowest figures in both categories. China […]

The bar chart below shows top ten countries for the production and consumption of electricity in 2014.

The figure presents data relating to the quantities of electricity (measured in billions of kilowatts per hour) produced and used in 2014 by the ten countries in the world that produce and use the greatest amount of electricity. China is the largest electricity producer and consumer among all the countries, with 5,398 billion kWh of […]

The bar chart below shows top ten countries for the production and consumption of electricity in 2014.

The given bar chart illustrates information regarding the electricity production and consumption of the ten leading countries worldwide in 2014, measured in billion kWh. Generally, the majority of these nations produced a surplus of electricity over their actual consumption, with Germany as the sole exception to this pattern. Another notable observation is that the figures […]

The bar chart below shows top ten countries for the production and consumption of electricity in 2014.

The bar chart illustrates the electricity production and consumption levels in the top ten countries in 2014, measured in billion kilowatt-hours (kWh). Overall, China and the United States were the largest producers and consumers of electricity, significantly surpassing the other nations. Most countries generated slightly more electricity than they consumed, with the exception of Germany, […]

See All

Other Topics:

The chart below gives information about the growth of urban population in certain parts of the world including the prediction the future. of

The chart demonstrates the information abouth the urban population group growth of the universe such as Whole World, Africa, Asia, Latin America by years of 1950,2000, and 2030 Among the resutls Latin America came as most people live in city and will live in urbanization most . in 1950 their percentage started as biggest already […]

The chart below shows the expenditure on three categories among different age groups of residents in the UK in 2004

The chart illustrates citizens’ expenditure on three certain categories in five different age groups in Britain in 2004. In conclusion, citizens’ spending on food and drink witnessed an upward trend as the age grew. By comparison, the expenditure on restaurant and hotel decreased overall. As the age groups get older, citizens’ budgets on entertainment climbed […]

Task 01: Bar Chart The chart below shows waste collection by a recycling centre from 2011 to 2015 Waste collected by a recycling centre (tons of waste)

The bar chart compared the waste collection by a recycling centre from 2011 to 2015. Overall, all types of waste fluctuated, with paper having the highest figure at the end of the period, while garden had the lowest. At the begining of the period, 57 tons of paper were collected by a recycling centre, which […]

The bar chart shows shares of expenditures for five major categories in the USA, Canada, the UK and Japan in 2009. Summarize the information by selecting and reporting the main features and make comparisons where relevant.

The bar chart illustrates the percentage of expenditure for food, housing, transportation, health care and clothing in the US, Canada, the UK and Japan. overall, food and housing expenses were majority expenses. Clothing and health care accounted for a fewer pie. For the food expenditure, in Japan, it accounted for just around 23 percent. In […]

the graph shows the percentages of people going to the cinemas in a European country on different days

The bar chart illustrates days of week and the proportion of people going to cinemas in a European country in 2003, 2005 and 2007. Overall, the percentage of people on the first 4 days was under a quarter, whereas on Friday people showed the same proprtion. Meanwhile, Saturday demonstrated the most significant percentage in comparison […]

The chart below shows the spending (in millions) by 18-20 year olds in one country on five different products in 2010 and 2014. Summarise the information by selecting and reporting the main features, and make comparisons where relevant. Write at least 150 words.

The bar chart illustrates the expenditure of people aged from 18 to 20 years use for serval products in a country between 2010 and 2014. Overall, it can be clearly seen that teenagers spent most money for food, it was recorded the significant rise over the period, follow this upward trend was smartphones. In contrast, […]

See All
We have detected unusual activity on your device.
Please verify your identity to continue.
Note: This verification step won't sign you in. If you have a premium account, please log in to access the service as usual.
Google/Gmail Verification
Or verify using Email/Code
We've sent a verification code to:
youremail@gmail.com (Not your email?)
Enter it below to complete the verification process.
Ensure your email address is correct, your inbox is not full, and you check your spam folder. If no email arrives, consider using an alternative email.
You will need a Premium plan to perform your action!
Note: If you already have a premium account, please log in to access our services as usual.

Plans & Pricing

Our mission is to make quality education accessible for everyone.
However, to keep our hardworking team running and this service alive, we genuinely need your support!
By opting for a premium plan, not only do you sustain us in achieving the mission, but you also unlock advanced features to enrich your learning experience.

Free

For learners who aren't pressed for time

What's included on Free
100+ Cambridge IELTS Tests
Instant IELTS Writing Task 1 & 2 Evaluation (2 times/month)
Instant IELTS Speaking Part 1, 2, & 3 Evaluation (2 times/month)
Instant IELTS Writing Task 1 & 2 Essay Generator (2 times/month)
500+ Dictation & Shadowing Exercises
100+ Pronunciation Exercises
Flashcards
Other Advanced Tools

Premium

For those serious about advancing their English proficiency, and for IELTS candidates aspiring to boost their band score by 1-2 points (especially in writing & speaking) in just 30 days or less

What's included on Premium
Save Your IELTS Test Progress & Analyze Mistakes By Question Type
Save Your Own Flashcard Sets & Use Them On Any Device
Unlock All Courses, IELTS Tests, Section & Part Practice
Unlimited AI Conversations
Unlimited AI Writing Enhancement Exercises
Unlimited IELTS Writing Task 1 & 2 Evaluation
Unlimited IELTS Speaking Part 1, 2, & 3 Evaluation
Checked Answers Will Not Be Published
Unlimited IELTS Writing Task 1 & 2 Essay Generator
Unlimited IELTS Speaking Part 1, 2, & 3 Sample Generator
Unlimited Usage Of Advanced Tools & AI Features
Priority Support within 24h (12-month plan only)

Due to the nature of our service and the provided free trials, payments are non-refundable.