Our system will evaluate the answer based on this AI-generated description.
The image depicts a bar graph of museum visitors from June to December with the y-axis representing visitor numbers from 0 to 800,000, and the x-axis representing months. Bars are color-coded for four museums: History Museum (dark blue), British Museum (light blue), National Museum (grey), and Science Museum (teal). June's visitors: History Museum - 400,000, British Museum - 450,000, National Museum - 550,000, Science Museum - 320,000. July's visitors: History Museum - 480,000, British Museum - 350,000, National Museum - 600,000, Science Museum - 470,000. August's visitors: History Museum - 700,000, British Museum - 480,000, National Museum - 610,000, Science Museum - 320,000. September's visitors: History Museum - 400,000, British Museum - 420,000, National Museum - 720,000, Science Museum - 350,000. December's visitors: History Museum - 200,000, British Museum - 150,000, National Museum - 300,000, Science Museum - 200,000.
Given the complexity of the image, the above description may not be entirely accurate.
Skyrocket your IELTS band score by 1-2 points in under a month with our premium plan!
Note: Both the topic and the answer were created by one of our users.
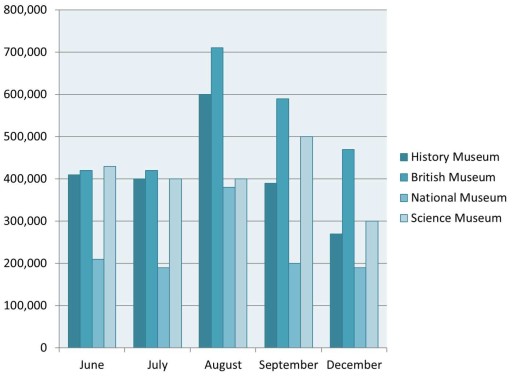
The provided chart illustrates how many visitors who visited various museums in London between july and december from history, British, national and science museums. The figures is in numbers.
Overall, august showed the highest number of visitors from Biritish museum compared to other months; also, the fewest visitors belonged to national museums in all months. In the august and july, science museums reported equal statistics.
In july and june, a negligible different in the numbers of visitors compared from British and history museums, which was at about 400,000, but this figure was over 400,000 for science museums in june; in contrast to july. National museums accounted for just 200,000 visitors.
However, British museums compired over 700,000, under 600,000, and 450,000 visitors respectively in auguest, september, and december. The biggest visitors was 500,000 from science museums in september than august and december roughly 400,000 and 200, 000 consecutively. In september and december, national and history museums experienced the half of people who visited in august (600,000 400,000 and ).
Word Count: 168