Our system will evaluate the answer based on this AI-generated description.
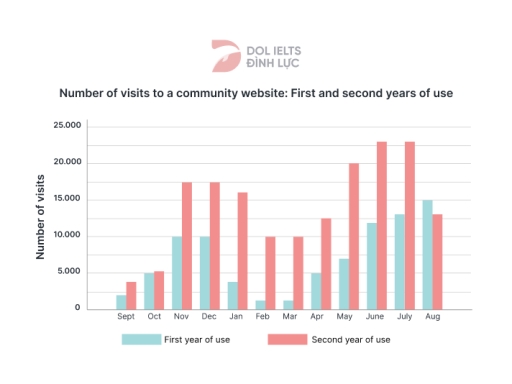
The image features a vertical bar chart titled "Number of visits to a community website: First and second years of use", with the vertical axis representing "Number of visits" spanning from 0 to 25.000 in intervals of 5.000 (0, 5.000, 10.000, 15.000, 20.000, 25.000) and the horizontal axis listing twelve months: Sept, Oct, Nov, Dec, Jan, Feb, Mar, Apr, May, June, July, and Aug. For each month, two categories are compared—"First year of use" and "Second year of use": Sept shows approximately 2.000 visits for the first year and 3.600 for the second year; Oct shows roughly 4.900 for the first year and 5.200 for the second year; Nov shows 10.000 for the first year and 17.500 for the second year; Dec records 10.000 for the first year and 17.500 for the second year; Jan shows roughly 3.600 for the first year and 16.000 for the second year; Feb records about 1.000 for the first year and 10.000 for the second year; Mar exhibits about 1.000 for the first year and 10.000 for the second year; Apr shows about 4.900 for the first year and 12.500 for the second year; May displays roughly 6.800 for the first year and 20.000 for the second year; June shows roughly 11.800 for the first year and 23.000 for the second year; July indicates roughly 13.000 for the first year and 23.000 for the second year; and Aug displays 15.000 for the first year and roughly 13.000 for the second year.
Given the complexity of the image, the above description may not be entirely accurate.
Skyrocket your IELTS band score by 1-2 points in under a month with our premium plan!
Note: Both the topic and the answer were created by one of our users.
The bar chart illustrates the amounts of people visiting a community website in the first and second years of use.
Overall, the second year of use generally had the higher figures throughout the given period. In addition, people mostly used the website in June and July in the second year, while in the first year of use, February and March were the least preferred months for use.
In the first year, 2,500 people were recorded in September, followed by a significant growth to 10,000 in November. After two years remained unchanged, this figure decreased considerably by 7,500 in February and maintained its figure in the next month. By contrast, the number of visitors showed a strong preference for using the website in the latter half of the period and ultimately ended at 15,000 in August.
A similar pattern, but to a greater extent, can be observed in the number of users in the second year. The amount of visits began at 4,000, before rising dramatically to 17,500 in November. Although this growth, the figure declined to 10,000 and levelled off in both years, February and March. However, it then recovered and even dominated the ranking across all months, recording 23,000 in June and July.
Word Count: 204
