Our system will evaluate the answer based on this AI-generated description.
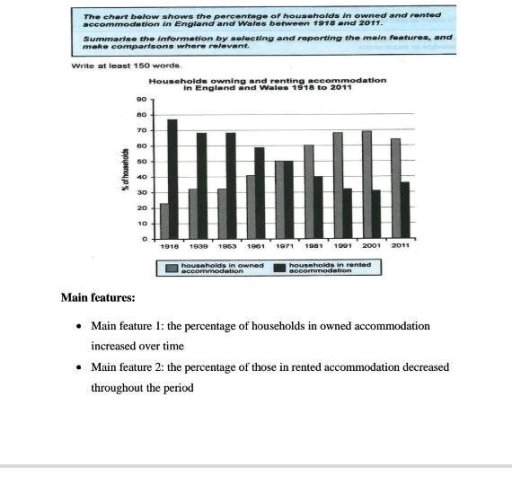
The image shows a bar graph with two types of data - households in owned accommodation and households in rented accommodation in England and Wales from the years 1918 to 2011. Households in owned accommodation in 1918 have a percentage of approximately 23, which increases to approximately 31 in 1939, approximately 32 in 1953, approximately 42 in 1961, approximately 51 in 1971, approximately 57 in 1981, approximately 68 in 1991, approximately 69 in 2001, and approximately 64 in 2011. Households in rented accommodation in 1918 have a percentage of approximately 77, which decreases to approximately 69 in 1939, approximately 68 in 1953, approximately 58 in 1961, approximately 49 in 1971, approximately 43 in 1981, approximately 32 in 1991, approximately 31 in 2001, and approximately 36 in 2011. The bar graph demonstrates two main features: 1) an increase in the percentage of households in owned accommodation and 2) a decrease in the percentage of households in rented accommodation over the period from 1918 to 2011.
Given the complexity of the image, the above description may not be entirely accurate.
Skyrocket your IELTS band score by 1-2 points in under a month with our premium plan!
Note: Both the topic and the answer were created by one of our users.
The bar chart illustrates the proportion of housholds in owned and rented accommodation in England and Wales between 1918 and 2011.
Overall,the percentage of households in rented accommodation decreased through out the period while the percenatge of households in owned accomodation increased dramatically through out the period.
From 1918 upto 1971, the percentage of households in owned accommodation increased steadily just above 20% to 50%, whereas the proportion of households in rented accommodation decreased gradually from nearly 80% to 50% ,both being equal in 1971.
Looking at the percentage amount of households in owned accommodation between 1971 and 2011, it increased 10% for the following two decades while it remained constant at approximately 70% between 1991 upto 2001 showing a slight decrease to nealry 65% in 2011. On the other side, the percentage amount of households in rented accommodation showed a 10% decrease for the following two decades while it remained constant at approximately 30% between 1991 upto 2001 showing a slight increase to approximately 35%.
Word Count: 166
