Our system will evaluate the answer based on this AI-generated description.
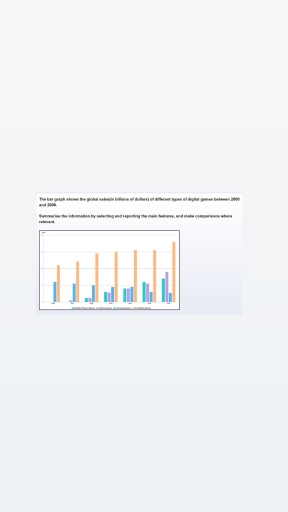
The image displays a bar graph comparing global sales (in billions of dollars) of different types of digital games between 2000 and 2006 across four categories: Mobile Games, Online Games, Console Games, and Handheld Games. In 2000, Mobile and Online Games sold 0, Console Games sold ~6, Handheld Games sold ~11. In 2001, Mobile and Online Games sold 0, Console Games sold ~5, Handheld Games sold ~12. In 2002, Mobile Games sold ~1, Online Games sold ~0, Console Games sold ~4, Handheld Games sold ~13. In 2003, Mobile Games sold ~2, Online Games sold ~1, Console Games sold ~4, Handheld Games sold ~14. In 2004, Mobile Games sold ~3, Online Games sold ~2, Console Games sold ~4, Handheld Games sold ~14. In 2005, Mobile Games sold ~5, Online Games sold ~4, Console Games sold ~3, Handheld Games sold ~15. In 2006, Mobile Games sold ~7, Online Games sold ~10, Console Games sold ~3, Handheld Games sold ~17.
Given the complexity of the image, the above description may not be entirely accurate.
Skyrocket your IELTS band score by 1-2 points in under a month with our premium plan!
Note: Both the topic and the answer were created by one of our users.
The bar chart provides information about global sales of ferries electronic games from 2000 to 2006.
From an overall perspective at the beginning, there was only two type of games, but in 2006 mode of games increased to four. Console game sales decreased gradually, while the reverse was true for the remaining three. In all years, handheld games were the dominant figure with its sales.
Commencing with the games which witnessed an increase initially, handheld ones starting point was just above $10 billions and steadily went up to $18 billions in 2006. Despite being introduced in 2001, online game sales were $1 billion in that year. The figure grew by $7 billions in the last year. Mobile phone games, however, launched it in 2002, but had the similar sales rate with online games approximately $2 billions. The sales of mobile gadget grew to $9 billions becoming the second game with its sale.
Regarding the decreases, console games experienced a downward trend, starting with just about $6 billions figure continuously dropped to $2.5 billions.
Word Count: 173
