🔥 Today Only: Save 30% on Premium — Offer Ends Soon! - Upgrade Now!
Line Graph

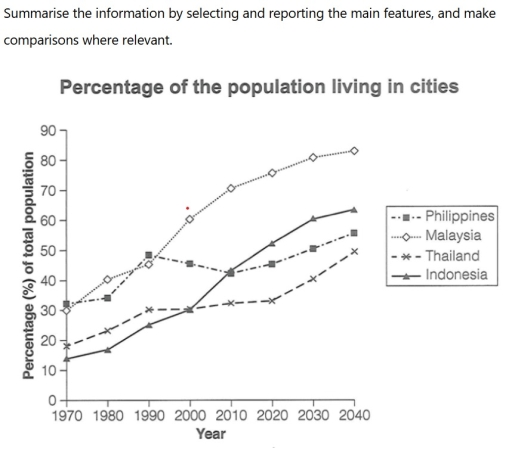
Band 7+: The below line graph shows the percentage of population living in cities.

Image for topic: The below line graph shows the percentage of population living in cities.
Our system will evaluate the answer based on this AI-generated description.
The image displays a line graph titled "Percentage of the population living in cities" with a y-axis for "Percentage (%) of total population" from 0 to 90 and an x-axis for "Year" from 1970 to 2040. Data points for the four countries depicted are: Philippines - 1970 (approx. 32%), 1980 (approx. 34%), 1990 (approx. 49%), 2000 (approx. 46%), 2010 (approx. 43%), 2020 (approx. 46%), 2030 (approx. 51%), 2040 (approx. 56%); Malaysia - 1970 (approx. 29%), 1980 (approx. 41%), 1990 (approx. 46%), 2000 (approx. 61%), 2010 (approx. 71%), 2020 (approx. 76%), 2030 (approx. 81%), 2040 (approx. 83%); Thailand - 1970 (approx. 19%), 1980 (approx. 23%), 1990 (30%), 2000 (approx. 31%), 2010 (approx. 33%), 2020 (approx. 34%), 2030 (approx. 42%), 2040 (50%); Indonesia - 1970 (approx. 14%), 1980 (approx. 17%), 1990 (25%), 2000 (30%), 2010 (approx. 43%), 2020 (approx. 53%), 2030 (approx. 61%), 2040 (approx. 64%).
Given the complexity of the image, the above description may not be entirely accurate.
Note: Both the topic and the answer were created by one of our users.

The line graph illustrates the changes in population rate living in cities in four Asian countries between 1970 and 2020 along with predictions for 2030 and 2040.

Overall, all four countries experienced an increase in terms of the urban population with different trends throughout the decades.

To commence, the percentage of Indonesian population in 1970 was recorded as the lowest point, at approximately 14%. Whilst it is projected that the number of people in Malaysia will reach its peak in 2040 by more than 80%. We can see that there is only a slight increase throughout the years in the Philippines which showed only 20%. Then, Indonesia experienced a significant rise by more than 50%.

Turning to a comparison, in 1980 the population of Malaysia was almost twice that of Thailand. Meanwhile, there was a similar growth rate in Thailand and Indonesia in 2000 which presented around 30%. Another identical figure was also found in 2010 between Philippines and Malaysia, at nearly 45%.

Word Count: 163

Answers On The Same Topic:

The below line graph shows the percentage of population living in cities.

The line graph demonstrates the rate of population in four different countries in Asia in cities starting in 1970 and including the forecast for 2040. Overall, it is evident that all countries will witness an upward trend in terms of population, although Malaysia will experience the most dramatic increase, while the reverse will be true […]

The below line graph shows the percentage of population living in cities.

The line graph illustrates the changes in the population rate of people living in cities in four Asian countries between 1970 and 2020, along with predictions for 2030 and 2040. Overall, all four countries experienced an increase in the urban population, with different trends throughout the decades. To commence, the percentage of the Indonesian population […]

The below line graph shows the percentage of population living in cities.

The percentages of population in four Asian countries- Philippines, Malaysia, Thailand and Indonesia living in urban areas between 1970 to 2020 with expected for 2030 to 2040 is illustrated by the line graph. To have a glance, Asian countries were and will have significant growth during the period. Malaysia was the highest populace in given […]

The below line graph shows the percentage of population living in cities.

The graph illustrates the proportion of population living in urban areas in four countries between 1970 and 2040. Overall, all four countries experienced a high rate of migration with the same upward pattern. Particularly, Malaysia and Indonesia underwent a rapid increase while others grew a bit slowly over the period. Starting from mostly 30% in […]

See All

Other Topics:

The chart below shows purchase levels of four meats in the UK from 1974 to 2011

The line graph delineates purchase levels of chicken, beef, pork, and lamb in Britain between 1974 and 2011. Looking from an overall perspective, the most striking thing is that the grams of chicken and beef showed a reverse position. Interestingly, the grams of beef was the highest figure among the others. In fact, the usage […]

The graph shows information about the number of people in Australia who used Chinese, Arabic, Italian, and Greek as their first language.

The line chart shows change in the number of people in Australia used Chinese, Arabic, Italian and Greek as their first language from 1986 to 2011. Overall, the figure for Chinese and Arabic increase consistently in the period of study, while the remaining languages decreased. Moreover, Chinese speakers remain its dominant in the last decade […]

The graph below shows the crude marriage rate in five different countries between 1980 and 2020. Summarise the information by selecting and reporting the main features and make comparisons where relevant.

The line graph compares the crude marriage rates in five particular nations, namely the USA, the UK, Japan, Italy and Sweden, from 1980 to 2020. Overall, all sectors exhibited downward trends over 40 years, with an exception for Sweden, which was reported to fluctuate in the middle of the given period. Notably, it was clear […]

The line graph illustrates the sales of children's, adult fiction, and educational books in a selected country from 2002 to 2006.

The given graph depicts the sales of books in one selected country, from 2002 to 2006. It also highlight the main features and make contrasts them where relevant. Overall, the graph illlustrates the marketing of books in three categories: children’s books, adult fiction, and educational books. Significantly, the contributed books for children is increased from […]

Task 1: The line graph shows the percentages of Australian exports with four countries. Summarize the information by selecting and reporting the main features and make comparisons where relevant. (Line Graph)

The line graph illustrates the proportion of exportation of Australia to US, Japan, India, China between 1990 and 2012. Overall, while the percentage of Australian export with China, India witnessed upward trends, the opposite was true for Japan and US. In 1990, the proportion of exporting goods to Japan from Australia ranked the highest place, […]

The chart below shows the changes that took place in three different areas of crime in Panama City from 2010 to 2019. Summarise the information by selecting and reporting the main features, and make comparisons where relevant.

The line graph illustrates the crime rate’s change over a given period in Panama. Overall, it is clearly observed that although burglary had the highest rate for sevral years, car theft overtook its place. It is noticable that robbery almost remained stable. From 2000 to 2001 all three figured increased slightly. Burglary had the largest […]

See All
We have detected unusual activity on your device.
Please verify your identity to continue.
Note: This verification step won't sign you in. If you have a premium account, please log in to access the service as usual.
Google/Gmail Verification
Or verify using Email/Code
We've sent a verification code to:
youremail@gmail.com (Not your email?)
Enter it below to complete the verification process.
Ensure your email address is correct, your inbox is not full, and you check your spam folder. If no email arrives, consider using an alternative email.
You will need a Premium plan to perform your action!
Note: If you already have a premium account, please log in to access our services as usual.

Plans & Pricing

Our mission is to make quality education accessible for everyone.
However, to keep our hardworking team running and this service alive, we genuinely need your support!
By opting for a premium plan, not only do you sustain us in achieving the mission, but you also unlock advanced features to enrich your learning experience.

Free

For learners who aren't pressed for time

What's included on Free
100+ Cambridge IELTS Tests
Instant IELTS Writing Task 1 & 2 Evaluation (2 times/month)
Instant IELTS Speaking Part 1, 2, & 3 Evaluation (2 times/month)
Instant IELTS Writing Task 1 & 2 Essay Generator (2 times/month)
500+ Dictation & Shadowing Exercises
100+ Pronunciation Exercises
Flashcards
Other Advanced Tools

Premium

For those serious about advancing their English proficiency, and for IELTS candidates aspiring to boost their band score by 1-2 points (especially in writing & speaking) in just 30 days or less

What's included on Premium
Save Your IELTS Test Progress & Analyze Mistakes By Question Type
Save Your Own Flashcard Sets & Use Them On Any Device
Unlock All Courses, IELTS Tests, Section & Part Practice
Unlimited AI Conversations
Unlimited AI Writing Enhancement Exercises
Unlimited IELTS Writing Task 1 & 2 Evaluation
Unlimited IELTS Speaking Part 1, 2, & 3 Evaluation
Checked Answers Will Not Be Published
Unlimited IELTS Writing Task 1 & 2 Essay Generator
Unlimited IELTS Speaking Part 1, 2, & 3 Sample Generator
Unlimited Usage Of Advanced Tools & AI Features
Priority Support within 24h (12-month plan only)

Due to the nature of our service and the provided free trials, payments are non-refundable.