Our system will evaluate the answer based on this AI-generated description.
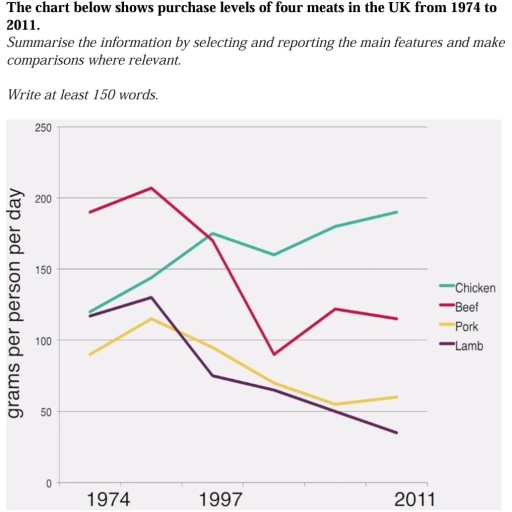
The image presents a line graph tracking the purchase levels of four meats - chicken, beef, pork, and lamb - in the UK for the years 1974, 1997, and 2011. The y-axis displays the weight of meat in grams per person per day ranging from 0 to 250, with markers at intervals of 50. The x-axis represents the years in question.
In 1974, beef had the highest purchase level at just over 200g, followed by chicken at just under 150g, then lamb at approximately 150g, and pork was the least purchased at around 100g. By 1997, chicken saw a dramatic increase to around 250g, becoming the most purchased meat, while beef and lamb experienced a significant decline to approximately 100g and 50g respectively, and pork remained relatively stable at around 100g. In 2011, chicken maintained its top position at nearly 250g, pork increased slightly to around 150g, beef continued to decrease to just over 50g, and lamb hit its lowest point at about 25g. Overall, chicken's popularity grew substantially, pork saw a small rise, while beef and lamb faced a steep downward trend over the 37-year period.
Given the complexity of the image, the above description may not be entirely accurate.
Skyrocket your IELTS band score by 1-2 points in under a month with our premium plan!
Note: Both the topic and the answer were created by one of our users.
The line graph delineates purchase levels of chicken, beef, pork, and lamb in Britain between 1974 and 2011.
Looking from an overall perspective, the most striking thing is that the grams of chicken and beef showed a reverse position. Interestingly, the grams of beef was the highest figure among the others. In fact, the usage of pork and lamb experienced a similar pattern; however, the grams of pork overtook those of lamb.
Looking at the details, there was an opposite trend in the daily usage of chicken and beef. In fact, in 1974 the grams of beef, which stood at just under 200, peaked around 210, while those of chicken started around 120 grams. Interestingly, in 1997 both usages changed their position, thus, the grams of chicken overtook those of beef. At this point, they showed a similar pattern at the end of the period their grams changed each other (chicken just under 200 grams, beef roughly 120 grams).
By contrast, the usage of pork and lamb went up slightly until around 1990. However, they experienced a fall from around 130 grams to just over 50 grams. Moreover, the usage of pork surpassed those of lamb until 2011. Thus, the grams of lamb and pork stopped around 45 and 55 respectively.
Word Count: 211
