🔥 Today Only: Save 30% on Premium — Offer Ends Soon! - Upgrade Now!
Multiple Graphs

Band 6+: The chart and graph below give information about participants who entered the Olympics since it began.

Image for topic: The chart and graph below give information about participants who entered the Olympics since it began.
Our system will evaluate the answer based on this AI-generated description.
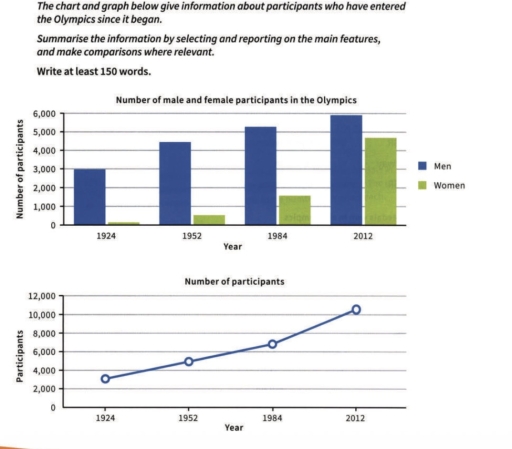
The image features two charts depicting Olympic participation across 1924, 1952, 1984, and 2012. The top bar chart, titled "Number of male and female participants in the Olympics," plots "Year" on the horizontal axis and "Number of participants" on the vertical axis from 0 to 6,000 in increments of 1,000, with a legend for "Men" and "Women". In 1924, Men are at approximately 3,000 and Women at around 150; in 1952, Men reach roughly 4,450 and Women approximately 500; in 1984, Men stand at around 5,300 and Women at about 1,600; in 2012, Men number around 5,900 and Women approximately 4,700. The bottom line graph, titled "Number of participants," plots "Year" on the horizontal axis against "Participants" on the vertical axis ranging from 0 to 12,000 with increments of 2,000, recording approximately 3,100 participants in 1924, 5,000 in 1952, 6,900 in 1984, and 10,600 in 2012.
Given the complexity of the image, the above description may not be entirely accurate.
Note: Both the topic and the answer were created by one of our users.

The bar chart shows information about how many men and women athletes in the Olypics from 1924 to 2012, while the line graph depicts data about the total number of participants in this games in the same period. Overall, it can be seen clearly that the number of both males and females who joined Olympics were an upward trend as same as the trend of total number of athletes.

Looking first at the bar chart, the number of male participants in the Olympics was an exactly 3000 in 1924, while that of females was nearly 0. However, there was a moderate increase in the number of men to just below 6,000 in 2012, which was more than that of women about 1,000, with approximeatly 5,000.

Moving on to the graph, the total number of athletes inclined steadily from about 3,000 in 1924 to around 5,000 in 1984, then there was a significant growth to above 10,000.

Word Count: 156

Other Topics:

You should spend about 20 minutes on this task. The chart below give information about travel to and from the UK, and about the most popular countries for UK residents to visit. Summarise the information by selecting and reporting the main features, and make comparisons where relevant. Write at least 150 words.

The line graph illustrates the number of visitors in million from the United Kingdom who went to abroad and overseas resident that came to the UK over the period from 1979 to 1999, while the bar chart provides information which countries were the most visited by the UK residents during 1999. Overall,it can be seen […]

The chart below shows the average time UK workers spent travelling to work and their methods of transportation in 2009.

The charts provide information about the average commuting time of the United Kingdom workers and their methods of travel to work in London and the rest of the UK in 2009. The overall percentage of workers declined with a lot of time spent travelling to work, recording a high number of employees who traveled to […]

The pie charts show the revenue sources and expenditures of a children's charity in the USA in one year. Summarize the information by selecting and reporting the main features, and make comparisons where relevant.

the pie chart illustrates amount of money received and spent to charity in USA in one year overall, the amount of money is almost the same. the largest proportion in expenditure pie chart is program services, it’s also the biggest part in both charts. the main part in revenue sources graph is donated food initially, […]

The pie charts show the revenue sources and expenditures of a children's charity in the USA in one year. Summarize the information by selecting and reporting the main features, and make comparisons where relevant.

the pie chart illustrates amount of money received and spent to charity in USA in one year overall, the amount of money is almost the same. the largest proportion in expenditure pie chart is program services, it’s also the biggest part in both charts. the main part in revenue sources graph is donated food initially, […]

The first chart shows the average housing prices in two cities in one country in 2010 and 2015, with projections for 2025. The second chart shows the percentage of people aged 30-35 who owned a home in 2010 and 2015.

The two graph represent two different studies. The first one is about the price of an house in two different cities and how it changes during time. From this first image we can say, overall, that buyng an house in the first city (city A) is more expensive than in city B. This could affected […]

See All
We have detected unusual activity on your device.
Please verify your identity to continue.
Note: This verification step won't sign you in. If you have a premium account, please log in to access the service as usual.
Google/Gmail Verification
Or verify using Email/Code
We've sent a verification code to:
youremail@gmail.com (Not your email?)
Enter it below to complete the verification process.
Ensure your email address is correct, your inbox is not full, and you check your spam folder. If no email arrives, consider using an alternative email.
You will need a Premium plan to perform your action!
Note: If you already have a premium account, please log in to access our services as usual.

Plans & Pricing

Our mission is to make quality education accessible for everyone.
However, to keep our hardworking team running and this service alive, we genuinely need your support!
By opting for a premium plan, not only do you sustain us in achieving the mission, but you also unlock advanced features to enrich your learning experience.

Free

For learners who aren't pressed for time

What's included on Free
100+ Cambridge IELTS Tests
Instant IELTS Writing Task 1 & 2 Evaluation (2 times/month)
Instant IELTS Speaking Part 1, 2, & 3 Evaluation (2 times/month)
Instant IELTS Writing Task 1 & 2 Essay Generator (2 times/month)
500+ Dictation & Shadowing Exercises
100+ Pronunciation Exercises
Flashcards
Other Advanced Tools

Premium

For those serious about advancing their English proficiency, and for IELTS candidates aspiring to boost their band score by 1-2 points (especially in writing & speaking) in just 30 days or less

What's included on Premium
Save Your IELTS Test Progress & Analyze Mistakes By Question Type
Save Your Own Flashcard Sets & Use Them On Any Device
Unlock All Courses, IELTS Tests, Section & Part Practice
Unlimited AI Conversations
Unlimited AI Writing Enhancement Exercises
Unlimited IELTS Writing Task 1 & 2 Evaluation
Unlimited IELTS Speaking Part 1, 2, & 3 Evaluation
Checked Answers Will Not Be Published
Unlimited IELTS Writing Task 1 & 2 Essay Generator
Unlimited IELTS Speaking Part 1, 2, & 3 Sample Generator
Unlimited Usage Of Advanced Tools & AI Features
Priority Support within 24h (12-month plan only)

Due to the nature of our service and the provided free trials, payments are non-refundable.