🔥 Today Only: Save 30% on Premium — Offer Ends Soon! - Upgrade Now!
Multiple Graphs

Band 5+: The chart below give information about levels of education in Glasgow, a city in Scotland, in 2010

Image for topic: The chart below give information about levels of education in Glasgow, a city in Scotland, in 2010
Our system will evaluate the answer based on this AI-generated description.
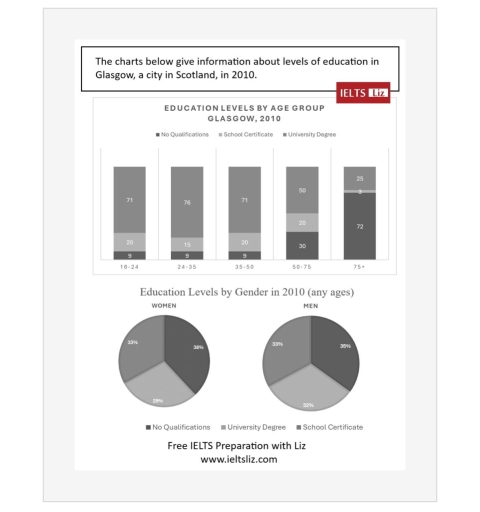
The image presents two sets of data on education levels in Glasgow, 2010: a bar chart displaying education levels by age group and a pie chart illustrating education levels by gender. In the age group bar chart, age 16-24 shows 71% with university degrees, 19% with school certificates, and 10% with no qualifications; age 25-35 indicates 71% university degrees, 20% school certificates, and 9% no qualifications; age 35-50 reveals 70% university degrees, 20% school certificates, and 10% no qualifications; age 50-75 shows 60% university degrees, 30% school certificates, and 10% no qualifications; age 75+ has 50% with school certificates, 25% each for university degrees and no qualifications. The gender-based pie chart demonstrates that women have 38% university degrees, 29% school certificates, and 33% no qualifications, whereas men possess 35% university degrees, 30% school certificates, and 35% no qualifications.
Given the complexity of the image, the above description may not be entirely accurate.
Note: Both the topic and the answer were created by one of our users.

he bar chart and pie charts illustrate the proportions of people in Glasgow having three levels of education (university, school, and those with no qualifications). Information is divided into five age groups in the bar chart and by gender in the pie charts.

Overall, approximately all Scottish have a bachelor’s degree except elderly have no qualifications. Furthermore, both sexes have nearly the same percentage of educational level, most women had no education meanwhile most of men had a university degree.

In terms of bar chart, the first three age groups from 16-24,24-35, to 35-50 had nearly the same figures of having university degree with 71, 76, and 71 respectively, but the numbers are dropped to 50 and 25 in the group ages 50-75 and over 75.In contrast, there are 72 numbers of old people had no educations, while young people in different ages had the same figures by merely 9.

However, around a third of men and women have school certification. Moreover, 32% of men had a university degree whereas women accounted for 29%, and the women who did not complete the qualifications was 38% and men was slightly behind 35%.

Word Count: 191

Answers On The Same Topic:

The chart below give information about levels of education in Glasgow, a city in Scotland, in 2010

The diagrams beneath illustrate an information about a degree of education among citizens of Glasgow in 2010. The data, which was gathered owing to various surveys, is distributed and compartmentalized into two different charts with an only age estimation and with gender difference. Implement with a fact, that the majority of people with university degree […]

See All

Other Topics:

The graphs below show the changes in average annual temperature and precipitation in four distinct ecological regions of Brazil between 1980 and 2020. Summarise the information by selecting and reporting the main features, and make comparisons where relevant.

The graphs gives information about how annual temperature and precipitation anomaly changed in four distinct ecological regions ( Amazon Rainforest, Cerrado, Atlantic Forest and Caatinga , namely) in Brazil from 1980 to 2020. Overall, average annual temperature anomalies showed upward trends in all four regions, whereas precipitation only showed upward trend in Atlantic Forest. In […]

The pie chart below illustrates the average commuting time of UK workers in 2009, while the bar chart compares the methods of travelling to work in London and the rest of the UK in the same year.

The charts demonstrate the average commuting time of workers in United Kingdom and the methods of travelling to work in London and the rest of the country in the 2009. Overall, short commutes were by far the most common, and the vast majority of workers spent no more than 30 minutes to get to work. […]

The graph below shows the weekly working hours or men and women omen in in government institutions and private institutions. Summarise the information by selecting and repairing the main features, and make comparisons where relevant.

The four pie charts depict the proportions of weekly working hours of men and women workers in government and private institutions. Overall, while the women sections’ shift hours on both government and private sectors illustrate almost identical proportions, whilst men’s working hours in both show remarkable difference in terms of 1-2 hours of work. It […]

The chart below illustrates the percentages of sales of one bookseller in 1970, 1997 and 2012. Summarise the information by selecting and reporting the main features, and make comparisons where relevant.

The pie charts compare the sales of an author in terms of five genres, in the years of 1970, 1997 and in 2012. Overall, the sales of adults and children’s fiction experienced an upward trend, while the reverse was true for others, biography and travel. It is worth mentioning that adult fiction was leading genre, […]

Task 1: The table and the chart below provide a breakdown of the total expenditure and the average amount of money spent by students per week while studying abroad in 4 countries. Summarize the information by selecting and reporting the main features, and make comparisons where relevant.

The table and bar chart show the total expenditure and average weekly spending of students studying abroad in four countries. Overall, country A is the most expensive destination for studying abroad, while, country D is the chepest. Living costs are the largest expence in countries A, B and C, whereas tuition fees are the highest […]

The diagrams below give information on transport and car use in Edmonton

The given charts illustrate transportation and vehicle usage in Edmonton. From an overall perspective, cars are the most prevalent form of transport. Moreover, citizens most often use their cars to go to work. Regarding the pie chart, the number of car commuters is the highest, standing at 45%, surpassing the figure for the LRT by […]

See All
We have detected unusual activity on your device.
Please verify your identity to continue.
Note: This verification step won't sign you in. If you have a premium account, please log in to access the service as usual.
Google/Gmail Verification
Or verify using Email/Code
We've sent a verification code to:
youremail@gmail.com (Not your email?)
Enter it below to complete the verification process.
Ensure your email address is correct, your inbox is not full, and you check your spam folder. If no email arrives, consider using an alternative email.
You will need a Premium plan to perform your action!
Note: If you already have a premium account, please log in to access our services as usual.

Plans & Pricing

Our mission is to make quality education accessible for everyone.
However, to keep our hardworking team running and this service alive, we genuinely need your support!
By opting for a premium plan, not only do you sustain us in achieving the mission, but you also unlock advanced features to enrich your learning experience.

Free

For learners who aren't pressed for time

What's included on Free
100+ Cambridge IELTS Tests
Instant IELTS Writing Task 1 & 2 Evaluation (2 times/month)
Instant IELTS Speaking Part 1, 2, & 3 Evaluation (2 times/month)
Instant IELTS Writing Task 1 & 2 Essay Generator (2 times/month)
500+ Dictation & Shadowing Exercises
100+ Pronunciation Exercises
Flashcards
Other Advanced Tools

Premium

For those serious about advancing their English proficiency, and for IELTS candidates aspiring to boost their band score by 1-2 points (especially in writing & speaking) in just 30 days or less

What's included on Premium
Save Your IELTS Test Progress & Analyze Mistakes By Question Type
Save Your Own Flashcard Sets & Use Them On Any Device
Unlock All Courses, IELTS Tests, Section & Part Practice
Unlimited AI Conversations
Unlimited AI Writing Enhancement Exercises
Unlimited IELTS Writing Task 1 & 2 Evaluation
Unlimited IELTS Speaking Part 1, 2, & 3 Evaluation
Checked Answers Will Not Be Published
Unlimited IELTS Writing Task 1 & 2 Essay Generator
Unlimited IELTS Speaking Part 1, 2, & 3 Sample Generator
Unlimited Usage Of Advanced Tools & AI Features
Priority Support within 24h (12-month plan only)

Due to the nature of our service and the provided free trials, payments are non-refundable.