Our system will evaluate the answer based on this AI-generated description.
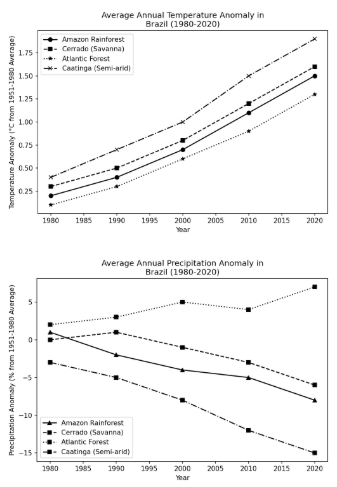
The image presents two line graphs detailing climate anomalies in Brazil from 1980 to 2020 across four regions: Amazon Rainforest, Cerrado (Savanna), Atlantic Forest, and Caatinga (Semi-arid). The upper graph, titled "Average Annual Temperature Anomaly in Brazil (1980-2020)", displays the x-axis "Year" (1980–2020 in 5-year increments) and y-axis "Temperature Anomaly (°C from 1951-1980 Average)" with values for 1980, 1990, 2000, 2010, and 2020: Amazon Rainforest: 0.2, 0.4, 0.7, 1.1, 1.5; Cerrado (Savanna): 0.3, 0.5, 0.8, 1.2, 1.6; Atlantic Forest: 0.1, 0.3, 0.6, 0.9, 1.3; Caatinga (Semi-arid): 0.4, 0.7, 1.0, 1.5, 1.9. The lower graph, titled "Average Annual Precipitation Anomaly in Brazil (1980-2020)", displays the x-axis "Year" (1980–2020 in 5-year increments) and y-axis "Precipitation Anomaly (% from 1951-1980 Average)" with values for 1980, 1990, 2000, 2010, and 2020: Amazon Rainforest: 1, -2, -4, -5, -8; Cerrado (Savanna): 0, 1, -1, -3, -6; Atlantic Forest: 2, 3, 5, 4, 7; Caatinga (Semi-arid): -3, -5, -8, -12, -15.
Given the complexity of the image, the above description may not be entirely accurate.
Skyrocket your IELTS band score by 1-2 points in under a month with our premium plan!
Note: Both the topic and the answer were created by one of our users.
The graphs gives information about how annual temperature and precipitation anomaly changed in four distinct ecological regions ( Amazon Rainforest, Cerrado, Atlantic Forest and Caatinga , namely) in Brazil from 1980 to 2020.
Overall, average annual temperature anomalies showed upward trends in all four regions, whereas precipitation only showed upward trend in Atlantic Forest. In the other regions, precipitation showed downward trends.
Regarding average annual temperature anomaly, Caatinga , which have highest temperatures anomaly in all the years, started at below 0.50 celcius, increasing to over 1.75 celcius. Likewise, Cerrado , which have second highest temperatures, increased about 0.30 celcius to about 1.40 celcius. Temperature of Amazon Rainforest and Caatinga were below 0.25 celcius in 1980 , rising to 1.25 celcius and approximately 1.10 celcius respectively in 2020.
For precipitation, Atlantic Forest, which has highest figures, started at about 2 celcius , rising to over 5 celcius. Cerrade showed a decrease in over zero to about -5 celcius. Similar to Cerrado, Amazon rainforest was 0 in 1980, reaching bottom of about -3 in 2020. As for Caatinga, it started at -3 and showed biggest decline by about -12 .
Word Count: 189
