Our system will evaluate the answer based on this AI-generated description.
The image depicts a bar graph titled "How people aged 25-34 are housed in the UK" representing the years 2004 to 2014. The vertical axis shows percentage, ranging from 0 to 70 in increments of 10. The horizontal axis lists the years incrementally. Each year has two bars representing "Home Owners" and "Renters". In 2004, Home Owners are approximately 60% and Renters 40%. 2005 shows Home Owners around 58% and Renters 42%. 2006 has Home Owners at roughly 56% and Renters 44%. In 2007, Home Owners are about 54% and Renters 46%. 2008 displays Home Owners at 52% and Renters 48%. For 2009, Home Owners are approximately 50% and Renters 50%. 2010 shows Home Owners around 48% and Renters 52%. 2011 has Home Owners at roughly 46% and Renters 54%. In 2012, Home Owners are about 44% and Renters 56%. 2013 displays Home Owners at 42% and Renters 58%. For 2014, Home Owners are approximately 40% and Renters 60%.
Given the complexity of the image, the above description may not be entirely accurate.
Skyrocket your IELTS band score by 1-2 points in under a month with our premium plan!
Note: Both the topic and the answer were created by one of our users.
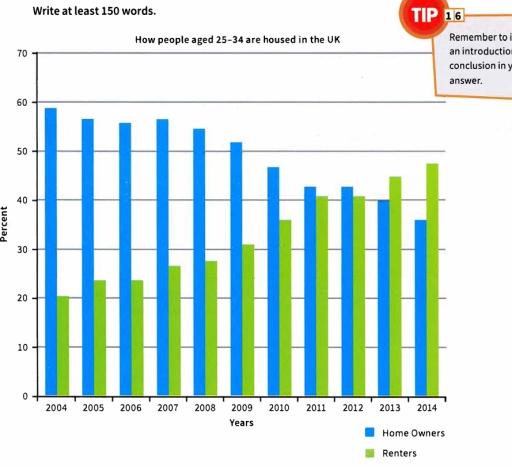
The bar chart illustrates how people aged from 25 to 34 are housed in the United Kingdom between 2004 till 2014, while vertical axis shows percentage of people renting the flats in comparison with humans owning the accommodation.
In 2004, the majority of people in this demographic were home owners, with over 50% owning their homes. However, from 2004 onwards, a steady decline in home ownership can be observed. By 2014, less than 40% of individuals in this age range owned homes, demonstrating a significant shift over the ten-year period.
On the other hand, the percentage of renters saw a consistent increase. In 2004, around 20% of people aged 25-34 were renters. This figure grew substantially over the years, surpassing the percentage of home owners by 2013. By 2014, over 40% of people in this age group were renting their homes, showing a notable reversal of trends from the beginning of the period.
In conclusion, the chart highlights a significant transformation in housing dynamics for people aged 25-34 in the UK, with home ownership becoming less common and renting becoming more prevalent over time.
Word Count: 184
