🔥 Today Only: Save 30% on Premium — Offer Ends Soon! - Upgrade Now!
Multiple Graphs

Band 7+: The chart below illustrates the number of international students (in thousands) in a particular country and the average annual university tuition fees (in US dollars) between 2010 and 2020.

Image for topic: The chart below illustrates the number of international students (in thousands) in a particular country and the average annual university tuition fees (in US dollars) between 2010 and 2020.
Our system will evaluate the answer based on this AI-generated description.
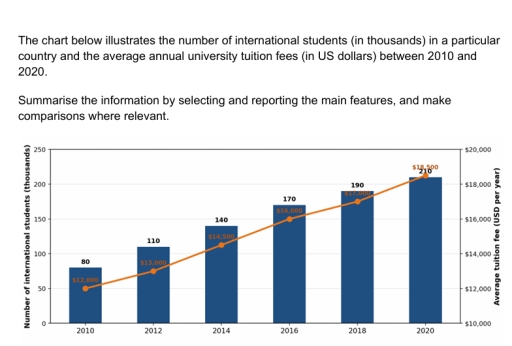
The image features a combination bar and line graph with years 2010, 2012, 2014, 2016, 2018, and 2020 on the horizontal axis. The primary vertical axis on the left is labeled "Number of international students (thousands)" ranging from 0 to 250 in increments of 50, represented by bars. The secondary vertical axis on the right is labeled "Average tuition fee (USD per year)" ranging from $10,000 to $20,000 in increments of $2,000, represented by a line. Numerical values for each year are as follows: in 2010, international students: 80, average tuition fee: $12,000; in 2012, international students: 110, average tuition fee: $13,000; in 2014, international students: 140, average tuition fee: $14,500; in 2016, international students: 170, average tuition fee: $16,000; in 2018, international students: 190, average tuition fee: $17,000; and in 2020, international students: 210, average tuition fee: $18,500.
Given the complexity of the image, the above description may not be entirely accurate.
Note: Both the topic and the answer were created by one of our users.

The bar chart compares the number of international students who studied, and the line chart illustrates the amount of tuition fee paid by the pupils in a particular country from 2010 to 2020.

It is clear that the number of international students and the amount of tuition fee was the highest in 2020, whereas and the number of international learners and the amount of tuition fee was the lowest in 2010.

Looking at the line chart in more detail, the amount of money spent by students increased significantly by $4000, rising from $12000 to $16000 between 2010 and 2016. Moreover, from 2016 to 2020, a significant surge of $2500 was seen in the amount of tuition fee paid by students.

Regarding the remaining, the number of international students who studied grew gradually by 60, rising from 80 to 140 from 2010 to 2014. Furthermore, between 2014 and 2020, a dramatic rise of 70 was seen in the number of international students who studied.

Word Count: 163

Other Topics:

The chart below shows the average time UK workers spent travelling to work and their methods of transportation in 2009.

The charts report data on the commuting habits of UK workers in 2009, specifically detailing average travel times across the country and comparing transport methods used in London versus the rest of the UK. Overall, the vast majority of UK workers experienced relatively short commutes, with most trips taking under half an hour. Additionally, there […]

Task 1: The charts below show the differences in how people in 3 countries learned English in 2010 and 2015.

The pie charts illustrates the difference of how people learned English in 3 different countries in 2010 and 2015. Overall, almost the vast majority of people in all 3 countries learned English by Everning class in both periods given. While the number people learning online accounted for the least proportion in country A, the least […]

You should spend about 20 minutes on this tasks. The graph and chart below give information about 3D cinema screens and film releases. Summarize the information by selecting and reporting the main features, and make comparisons where relevant. Write at least 150 words.

The Data given in graphs provides information about 3D cinema screens and film releases over the years from 2005 to 2011-2012 Global Digital 3D screens got rise in the numbers from 0 to 40000 from 2005 onward and but specifically a rapid surge in the numbers from the year 2008 to 2011. Releases of Global […]

The charts below show the favorite takeaways of people in the UK and the number of Indian restaurants in the UK between 1960 and 2015.

The given charts illustrate the percentage of people who enjoying takeaways and compare how many Indian restaurants there are in the UK from 1960 to 2015. Overall , it can be seen that Chinese was the most popular of the favourite takeaways , while the opposite was true for Japanese and Greek . Béides , […]

The chart illustrates the proportion of water used for 6 products and the percentage of total income generated from these products in the same year.

The pie charts compare the percentage of water and percentage of total income from six products in 2004. Overall, it is clear that fruits and vegetables made up the largest proportion of the water usage and total income over the given period whereas the opposite trend observed in rice. In 2004, water consumption in fruits […]

See All
We have detected unusual activity on your device.
Please verify your identity to continue.
Note: This verification step won't sign you in. If you have a premium account, please log in to access the service as usual.
Google/Gmail Verification
Or verify using Email/Code
We've sent a verification code to:
youremail@gmail.com (Not your email?)
Enter it below to complete the verification process.
Ensure your email address is correct, your inbox is not full, and you check your spam folder. If no email arrives, consider using an alternative email.
You will need a Premium plan to perform your action!
Note: If you already have a premium account, please log in to access our services as usual.

Plans & Pricing

Our mission is to make quality education accessible for everyone.
However, to keep our hardworking team running and this service alive, we genuinely need your support!
By opting for a premium plan, not only do you sustain us in achieving the mission, but you also unlock advanced features to enrich your learning experience.

Free

For learners who aren't pressed for time

What's included on Free
100+ Cambridge IELTS Tests
Instant IELTS Writing Task 1 & 2 Evaluation (2 times/month)
Instant IELTS Speaking Part 1, 2, & 3 Evaluation (2 times/month)
Instant IELTS Writing Task 1 & 2 Essay Generator (2 times/month)
500+ Dictation & Shadowing Exercises
100+ Pronunciation Exercises
Flashcards
Other Advanced Tools

Premium

For those serious about advancing their English proficiency, and for IELTS candidates aspiring to boost their band score by 1-2 points (especially in writing & speaking) in just 30 days or less

What's included on Premium
Save Your IELTS Test Progress & Analyze Mistakes By Question Type
Save Your Own Flashcard Sets & Use Them On Any Device
Unlock All Courses, IELTS Tests, Section & Part Practice
Unlimited AI Conversations
Unlimited AI Writing Enhancement Exercises
Unlimited IELTS Writing Task 1 & 2 Evaluation
Unlimited IELTS Speaking Part 1, 2, & 3 Evaluation
Checked Answers Will Not Be Published
Unlimited IELTS Writing Task 1 & 2 Essay Generator
Unlimited IELTS Speaking Part 1, 2, & 3 Sample Generator
Unlimited Usage Of Advanced Tools & AI Features
Priority Support within 24h (12-month plan only)

Due to the nature of our service and the provided free trials, payments are non-refundable.