Our system will evaluate the answer based on this AI-generated description.
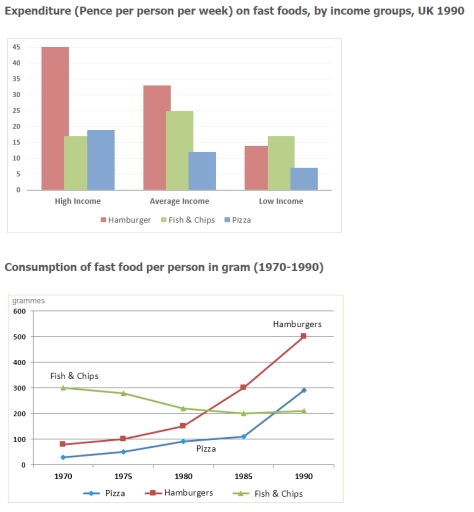
The image contains two graphs related to fast food consumption in the UK. The first graph, "Expenditure (Pence per person per week) on fast foods, by income groups, UK 1990" shows three income groups: High Income, Average Income, Low Income, with their expenditure on three types of fast foods: Hamburger, Fish & Chips, Pizza. High Income spends around 40 on Hamburgers, 25 on Fish & Chips, and 15 on Pizza. Average Income spends around 25 on Hamburgers, 30 on Fish & Chips, and 15 on Pizza. Low Income spends around 15 on Hamburgers, 20 on Fish & Chips, and 10 on Pizza. The second graph, "Consumption of fast food per person in gram (1970-1990)" is a line graph with three lines representing Pizza, Hamburgers, and Fish & Chips from 1970 to 1990. In 1970, Pizza is around 25 grams, Hamburgers 50 grams, and Fish & Chips 300 grams. In 1975, Pizza is around 50 grams, Hamburgers 150 grams, and Fish & Chips 375 grams. In 1980, Pizza is around 100 grams, Hamburgers 200 grams, and Fish & Chips 375 grams. In 1985, Pizza is around 200 grams, Hamburgers 325 grams, and Fish & Chips 350 grams. In 1990, Pizza is around 300 grams, Hamburgers 475 grams, and Fish & Chips 300 grams.
Given the complexity of the image, the above description may not be entirely accurate.
Skyrocket your IELTS band score by 1-2 points in under a month with our premium plan!
Note: Both the topic and the answer were created by one of our users.
The bar chart and line graph illustrate weekly expenditure on fast foods in Britain and trends in fast food consumption from 1970 to 1990.
Overall, hamburgers were the most popular fast food in terms of both spending and consumption. While the consumption of hamburgers and pizza rose over the period, the consumption of fish and chips declined after 1970. In addition, high-income households spent more on fast food than the other income groups.
According to the bar chart, high-income earners spent the most on hamburgers, followed by average-income earners. By contrast, pizza received the least expenditure from both average- and low-income groups. Fish and chips were also a significant item of spending, especially among lower-income households.
The line graph shows that hamburger consumption increased steadily from 1970 to 1990. Pizza consumption also rose, although it remained lower than that of hamburgers. Fish and chips, which had been the most consumed fast food in 1970, decreased until 1985 before recovering slightly by 1990.
Word Count: 162
