Our system will evaluate the answer based on this AI-generated description.
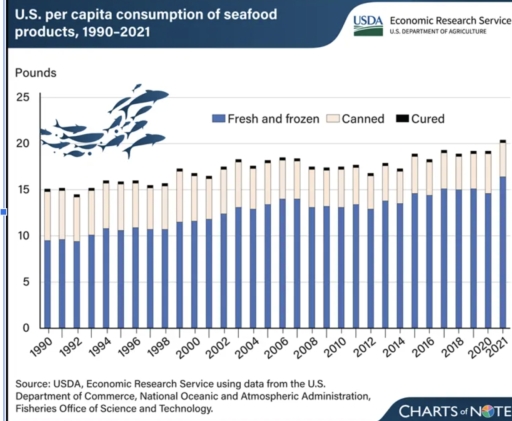
The image shows U.S. per capita seafood consumption in pounds from 1990 to 2021, divided into three categories: fresh and frozen, canned, and cured. In 1990, total consumption was approximately 15 pounds, with fresh and frozen around 9 pounds, canned 5 pounds, and cured 1 pound. 1992 saw a decrease to about 14 pounds. By 1994, consumption was back at around 15 pounds. The following years saw a gradual increase, reaching about 16 pounds in 1998 and approximately 18 pounds by 2000, with a continued rise to around 19 pounds in 2004. A decline occurred in 2005 to near 17 pounds. By 2007, it rose to approximately 16.7 pounds, decreasing again in 2010 to around 15 pounds. From 2010 to 2014, consumption remained fairly stable between 15 and 16 pounds. A slight increase is noted in 2015 at approximately 16 pounds, showing a gradual rise, peaking at approximately 19.1 pounds in 2020, and then a mild increase to about 20.5 pounds in 2021. Fresh and frozen consumption consistently contributed the largest portion, with a visible increase over the years, while canned remains relatively stable and cured minimally contributes.
Given the complexity of the image, the above description may not be entirely accurate.
Skyrocket your IELTS band score by 1-2 points in under a month with our premium plan!
Note: Both the topic and the answer were created by one of our users.
The line chart describes per capita consumption of seafood products in the United States from 1990 t0 2021, including different types of it such as fresh and frozen, canned and cured products.
Overall, it can be seen from the chart that despite some temporal fluctuations the trend to steady growth of consumption of seafood products existed within the aforementioned time period, whilst the main portion of consumption belonged to fresh and frozen products.
Fresh and frozen products were steadily playing the main role on the market of seafood products from 1990 to 2021. For instance, approximately 9,5 pounds of such products were consumed in 1990 and then a steady growth took place, finally reaching a peak of practically 17 pounds in 2021.
Canned products were much less popular during all the period. It is remarkable, that they were significantly more popular from 1990 (about 5 pounds) till 2014 (about 3 pounds), when their income into total consumption of seafood products fell down significantly. Finally, cured products never managed to become more or less popular among consumers, on the contrary, they embraced just a tiny portion of the market.
Word Count: 188
